












Wasting Time?
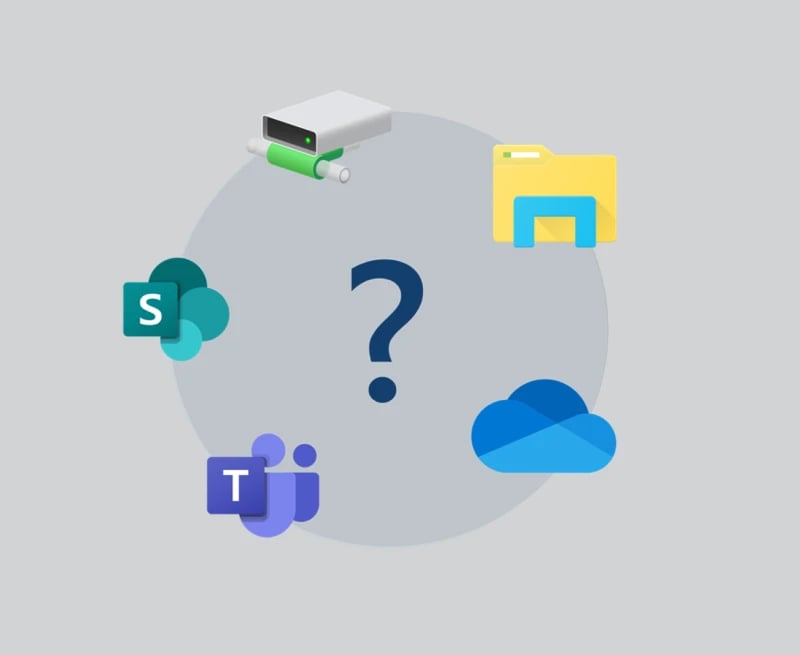
- Having trouble with presentation management?
- Slides scattered across different platforms and folders?
- Irrelevant or outdated content cluttering up your search results?
Doubting Your Slides?
- Is outdated content damaging your reputation?
- Numerous versions of slides circulating in the company?
- Constantly recreating slides because you can't find the latest version?
 At a glance
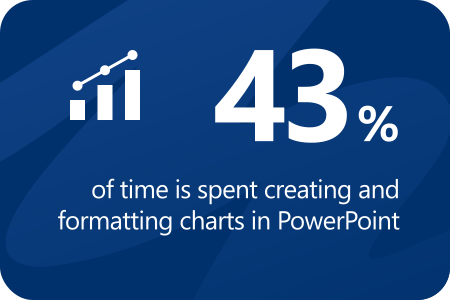
 Solution
Executive-quality reports
Modern charts combine elegant design with clarity and precision. As a result, complex data becomes instantly easier to understand and analyze, enabling quick, informed decisions.
Excel links and data processing
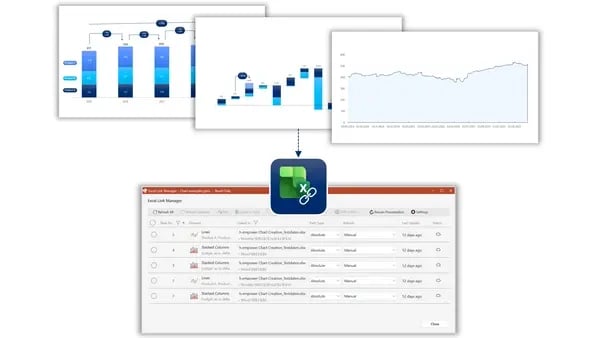
Charts can be linked directly to Excel files, whether they are stored locally, on a network, or in SharePoint and Teams, and managed through an Excel Link Manager. Relative file paths ensure that the links continue to work even when the PowerPoint and Excel file pair is moved.
Bye bye, Formatierungsaufwand!
Monotone Aufgaben führen zu monotonem Alltag anstatt zu Motivation und Effizienz. Formatieren Sie Ihre Präsentationen in Sekundenschnelle. Anordnen, positionieren, skalieren oder ausrichten - was mit PowerPoint jedes Mal ewig dauert, ist mit empower® in wenigen Handgriffen erledigt.
Autokorrektur für Flüchtigkeitsfehler
Klammer nicht geschlossen? Doppelte Leerzeichen? Punkt vergessen? Die Silbentrennung mal mit, mal ohne Bindestrich? Und der Markenname ist auch wieder falsch geschrieben? empower® erkennt und korrigert Flüchtigkeitsfehler automatisch. Anwendende erstellen bessere Ergebnisse ohne Prüfungsaufwand in kürzerer Zeit.
AI-Assistant: Text erstellen & optimieren
Die Erstellung und Optimierung von Text ist die größte Stärke künstlicher Intelligenz. Mit dem empower AI-Assistant integrieren Sie sie direkt in PowerPoint. Besonders praktisch: der AI-Assistant springt mit Ihnen automatisch von Folie zu Folie, von Form zu Form und sie erstellen und verbessern Text per Knopfdruck über voreingestellte Prompts. Das spart unzählige Klicks und führt zu perfekten Texten in kürzerer Zeit.
empower®- everything you need to create professional charts
 Mixed charts
Column and line charts can be combined in a single chart. Different scales can be shown clearly, so even complex relationships remain easy to compare.
 Consistent scaling across multiple charts
Multiple charts on a single slide can be scaled uniformly with just a few clicks. Axes and chart heights are adjusted automatically, making visual differences easier to compare and understand.
 Status elements for professional reporting
Harvey balls, icons, checkboxes, and markers help communicate status clearly. All elements can be customized as needed and enhance the clarity of reports and presentations.
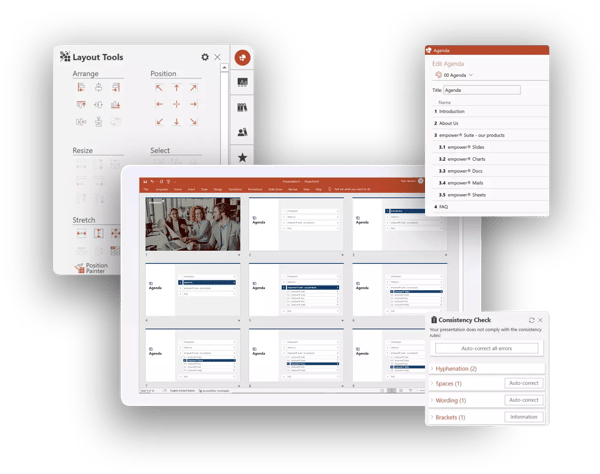
 50+ Practical Layout Tools
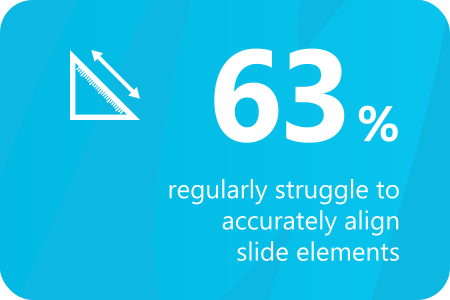
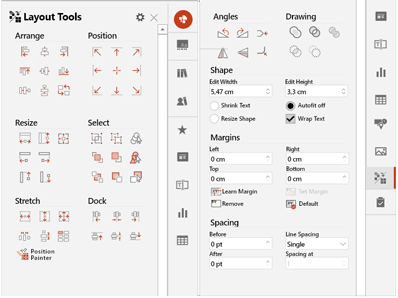
63% of employees spend time every day trying to align elements. That is why more than 50 layout tools help align, arrange, and structure content. As a result, presentations can be created much faster, with fewer manual adjustments.
 Agendas at the push of a button
63% of employees regularly struggle with the agenda slide. Enter topics, define the order, choose the format, and with one click, your agenda is ready in empower®. This helps you start every presentation in an organized and polished way.
 Save and share individual slides
Saving one or more slides from a presentation or sharing them by email usually requires switching between two to three screens and making about 20 clicks. With empower®’s Share feature, users stay on a single screen and need only 10 clicks. This saves time and helps keep the focus on what matters most.
 Pricing

empower® for Microsoft Teams
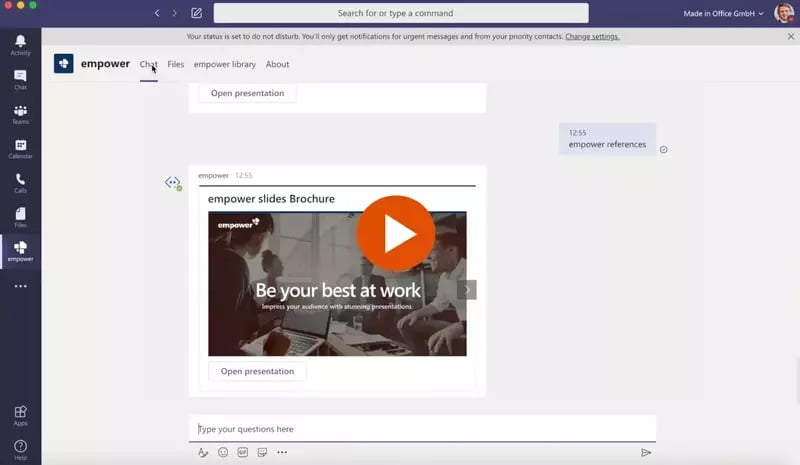
empower® also directly integrates with Microsoft Teams. People can browse the empower® Library or chat with the empower® Bot to find and open slides directly inside MS Teams.
A Slide Library that can grow with you
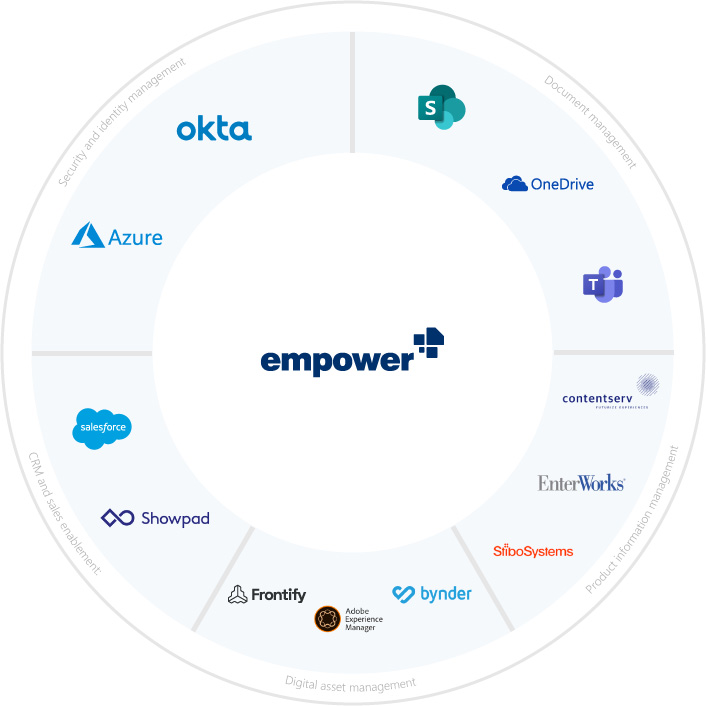
Our empower® slide library is designed to be flexible and grow with your organization. It integrates with other platforms like Sharpoint, Teams and other Digital Asset Management Systems and can be expanded with optional empower features as needed.
User Workspaces
User libraries provide your team with a personalized workspace within the slide library. This means easy slide organization, quick access to the content they need, and seamless collaboration – saving time and boosting your presentation creation process.
empower® Library explained in one minute

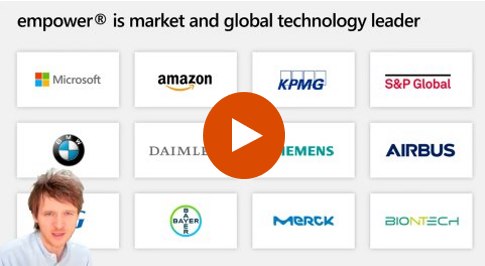
Ready to simplify slide management? Watch our demo video and see how empower® can transform your workflow:
- Find the perfect slide in seconds
- Always have the latest content
- Work seamlessly with PowerPoint
- Access slides anytime, anywhere
Fill out the form and see the empower® slide Library in action.
37%
Zeitverlust durch Formatierungsarbeiten
empower® AI & Automatisierung machen Formatierungsarbeit obsolet.

Inhalte und Vorlagen sind mit empower® stets einen Klick entfernt.
31%
aller Präsentationen schaden der Marke nachhaltig
empower® sorgt für 100% einheitliche Ergebnisse und strahlende Marken.

Challenge
For many years, Bayer used another PowerPoint chart-creation add-in across parts of the organization. As adoption grew to more than 6,000 licensed users, licensing and administrative costs increased significantly. Bayer needed a more scalable solution that could support professional chart creation, ensure brand consistency, and make efficient charting available to a much broader user base without adding more per-user licensing complexity.
Process
Bayer conducted an extensive proof of concept to evaluate empower® as an alternative. Users confirmed that all essential charting capabilities were covered and that existing charts could be transitioned smoothly through chart conversion. With only a few exceptions, more than 95 percent of users approved the solution, allowing Bayer to transition to empower® at the end of the existing license term.
Result
Bayer has now used empower® successfully for many years. The transition has helped Bayer save millions of euros in licensing and administrative costs while maintaining strong adoption across the organization. Demand for efficient chart creation remains high, and empower® continues to deliver consistently strong usage and user satisfaction.

Challenge
DHL Post & Paket needed an economically sustainable and scalable solution for creating diagrams in PowerPoint. Beyond the high licensing costs of its previous software, license management posed a significant administrative burden. Each year, the company had to assess its actual licensing requirements, involving an external service provider and engaging in multi-week coordination efforts.
Process
Following a comprehensive testing phase with a broad group of users, DHL Post & Paket selected empower® as a company-wide add-in for PowerPoint diagrams. The solution was implemented quickly and deployed across the organization to approximately 24,000 users under a corporate license agreement.
Result
By introducing the empower® corporate license, DHL Post & Paket eliminated the complex annual license management process entirely, as all 24,000 users were centrally provisioned with the software. This increased organization-wide productivity, reduced annual licensing costs, and significantly streamlined administrative operations.

Challenge
Brose previously used another chart creation add-in for PowerPoint with more than 1,000 licenses. Although all licenses were required, the company had to reduce the number of licenses due to cost constraints. As a result, many employees were limited to using PowerPoint’s native features for chart creation.
Process
Following a comprehensive evaluation, Brose rolled out empower® to all 16,000 employees. Cost-effective terms under a corporate license agreement ensured that expenses would remain predictable and controlled over the long term.
Result
The company now saves substantial annual licensing expenses while providing professional charting capabilities to its entire workforce. This supports Brose’s broader strategy of maintaining IT costs within a sustainable and predictable range while meeting the demands of a modern digital workplace.

The smart way to create charts with empower® Chart Creation
„empower® Chart Creation plays a key role for us […]. We no longer need any additional PowerPoint add-ins.“
Thomas Röhrich, Head of Brand Communications, Continental AG
With the release of version 8, Continental introduced empower® Chart Creation. Employees quickly recognized the value of creating complex charts in PowerPoint faster and more efficiently. Automated chart formatting saved valuable time and made the tool easy to use. Existing charts created with other charting add-ins could be converted into empower® charts in seconds, allowing users to continue working without interruption.

Standard & Poor's boosts Productivity by 30 Percent with empower®
"We consider empower® the gold standard for how Office products should be developed.“
Alyssa Le, VP Business Development
Like many organizations in the financial services industry, S&P creates a high volume of PowerPoint content, which can be highly time-intensive, particularly when working with complex charts and tables.
The company aimed to reduce the time required to create and format presentations while ensuring compliance and maintaining clear audit trails for all presentation changes.
More time for what truly matters
S&P rolled out empower® to 10,000 users. Its comprehensive productivity features streamline the creation of tables of contents and automate updates. Built-in tracking makes it easy to trace changes, and table and chart styles can be applied or modified with just a few clicks.
Since implementing empower®, overall productivity has increased by an average of 30 percent. This has freed up significant time that can now be dedicated to higher-value activities such as analyzing and evaluating data.

"empower® enables our users to create professional presentations in a fraction of the time. (...) Instead of managing multiple standalone add-ins, we now benefit from a comprehensive solution that reduces technical complexity and makes strong financial sense."
Felix Flüs, Head of Marketing & Communications

 Implementation
-
You send us the chart styles and color palette required for setup. We will review the contents for completeness and inform you of the setup timeframe. Typically, this takes 1–3 weeks, depending on the scope of the setup.
-
After the setup is complete and a revision cycle is finished, you will receive the prepared installation file along with technical documentation.
- Brief coordination with your IT department for technical preparation.
- Planning and inviting users to online training sessions.
- Your IT department deploys the software via your company’s software distribution platform. We provide technical support if needed.
- Users who receive the software participate in the online training or watch the recorded session and review the provided support materials.
- Measuring software usage through telemetry data.
- Planning specialized training sessions on specific topics to ensure maximum user adoption.
- We stay engaged until your expectations for the software are fully met.
 Implementation duration
Depending on the size of your organization, the software rollout takes 1–3 months.
 Required resources
Step 1:
- For the design setup, a designated person is needed to send us the company's chart styles and color palette and answer any related questions. This process takes approximately 1–2 hours.
- After the setup, this person will review the software’s visual appearance and officially approve it for use. This step also takes approximately 1–2 hours.
Step 2:
- The project lead invites all users to online training sessions and communicates key information about the new software in advance. This takes about 1 hour.
- The IT department deploys the software. While the actual deployment time is minimal, it may vary depending on verification procedures, outsourcing of software installation to service providers, or technical testing. The time required is primarily determined by your company’s processes.
- Participating in an online training session or watching the recorded version, as well as achieving initial work results with the new software, takes approximately 2 hours per person.
Step 3:
- Measuring software usage requires no effort on your part, as telemetry data is collected and analyzed by us.
- Planning additional training sessions takes about 1 hour, while each training session itself lasts approximately 30 minutes.
 Required IT involvement
Your IT department is responsible for deploying the software on users' PCs, providing first-level support, and handling software updates as needed (the latter only applies if your company opts out of automatic updates).
We offer 3–4 software updates per calendar year, though customers typically implement 1–2 updates annually.
The total IT and support effort amounts to approximately 0.25 FTE per year.

