Over 3 million people already trust empower® to create professional Office documents.
A whole new way to think of charting
easy
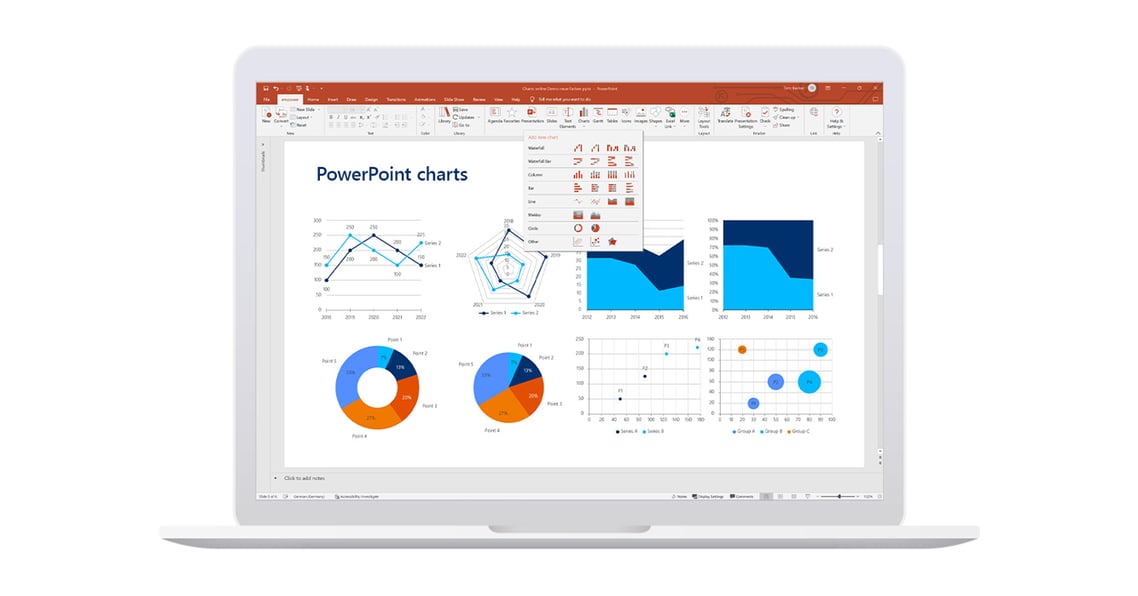
Creating complex charts is the time waster no. 1 in PowerPoint. With empower®, you can almost automatically create charts like Gantts and Waterfalls.
efficient
37 % of your time working with PowerPoint is spent formatting. With empower® you can format charts in no time, link them with Excel files, and add Arrows and Lines.
brand compliant
Most charts in presentations don‘t comply with brand-design guidelines. With predefined charts and custom Color Pickers, you can ensure every chart is brand compliant.
Get started with empower®
empower® makes working with Microsoft Office easier, more efficient and brand compliant.
 easy
easy
Your visualization dream team: Gantt and Waterfall
empower® for charts in PowerPoint streamlines creating and formatting charts, including Gantt and waterfall charts. A waterfall chart visualizes drivers for growth or reasons for cost savings as steps. Gantt charts help with project planning and reporting, showing activities and milestones on a timeline. As a PowerPoint add-in, empower® integrates seamlessly with how you work.
Waterfall
If you’ve ever created a waterfall chart manually, you know how cumbersome it can be. But with empower® for charts in PowerPoint, you can create waterfall charts dead easy. You can even insert subtotals per data series or show multiple waterfalls in a single chart.
Gantt
Manually creating Gantt charts for project plans and timelines in PowerPoint is a time-consuming headache. With empower®, you can create Gantt charts in minutes by point-and-click. Quickly add status, responsibilities, school holidays, and other elements that ensure comprehensive planning.
Define your timeline – whether it’s for a quick project or a multi-year roadmap.
Then add Rows, Tasks, Milestones, Datelines, Highlights, Delays, and Status Icons.
Waterfalls visualize the steps that cause an increase or a reduction in something. You can let Waterfall Charts grow from left to right, or right to left. Both vertical and horizontal Waterfall Charts are also supported.
Show multiple data series either as Stacked Columns and Bars or as Clustered Columns and Bars. Decide whether to show Sum Labels, Connector Lines, and Percentages, then format the Chart and add Arrows if you like.
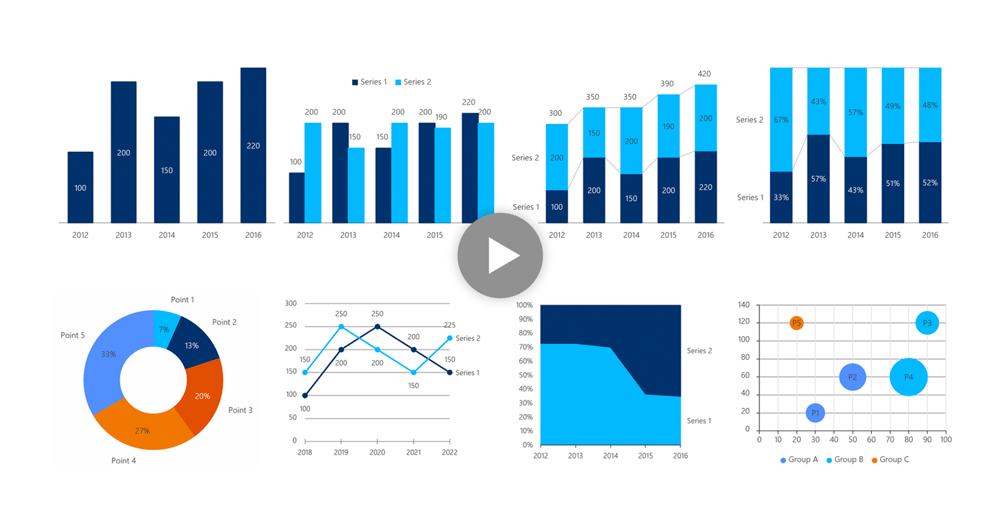
Use a Line Graph to show the evolution of data series over time. Define the scale and date format on your x-axis. Smooth and format your Lines and decide if you want to interpolate gaps.
Combine Column or Bar and Line Graphs. And in case of different scaling, you can use two value axes to combine differently scaled data series into one chart.
Visualize the shares or pieces that add up to 100%. Easily show Absolute Numbers, Percentages and Labels in your chart.
Show 100% Charts either as columns or bars or create a 100% Area Chart to show how relationships evolve over time.
Plot points with two dimensions into a Scatter Chart or add a third dimension by using a Bubble Chart.
Did you know?
The All-in-One Suite for Microsoft 365
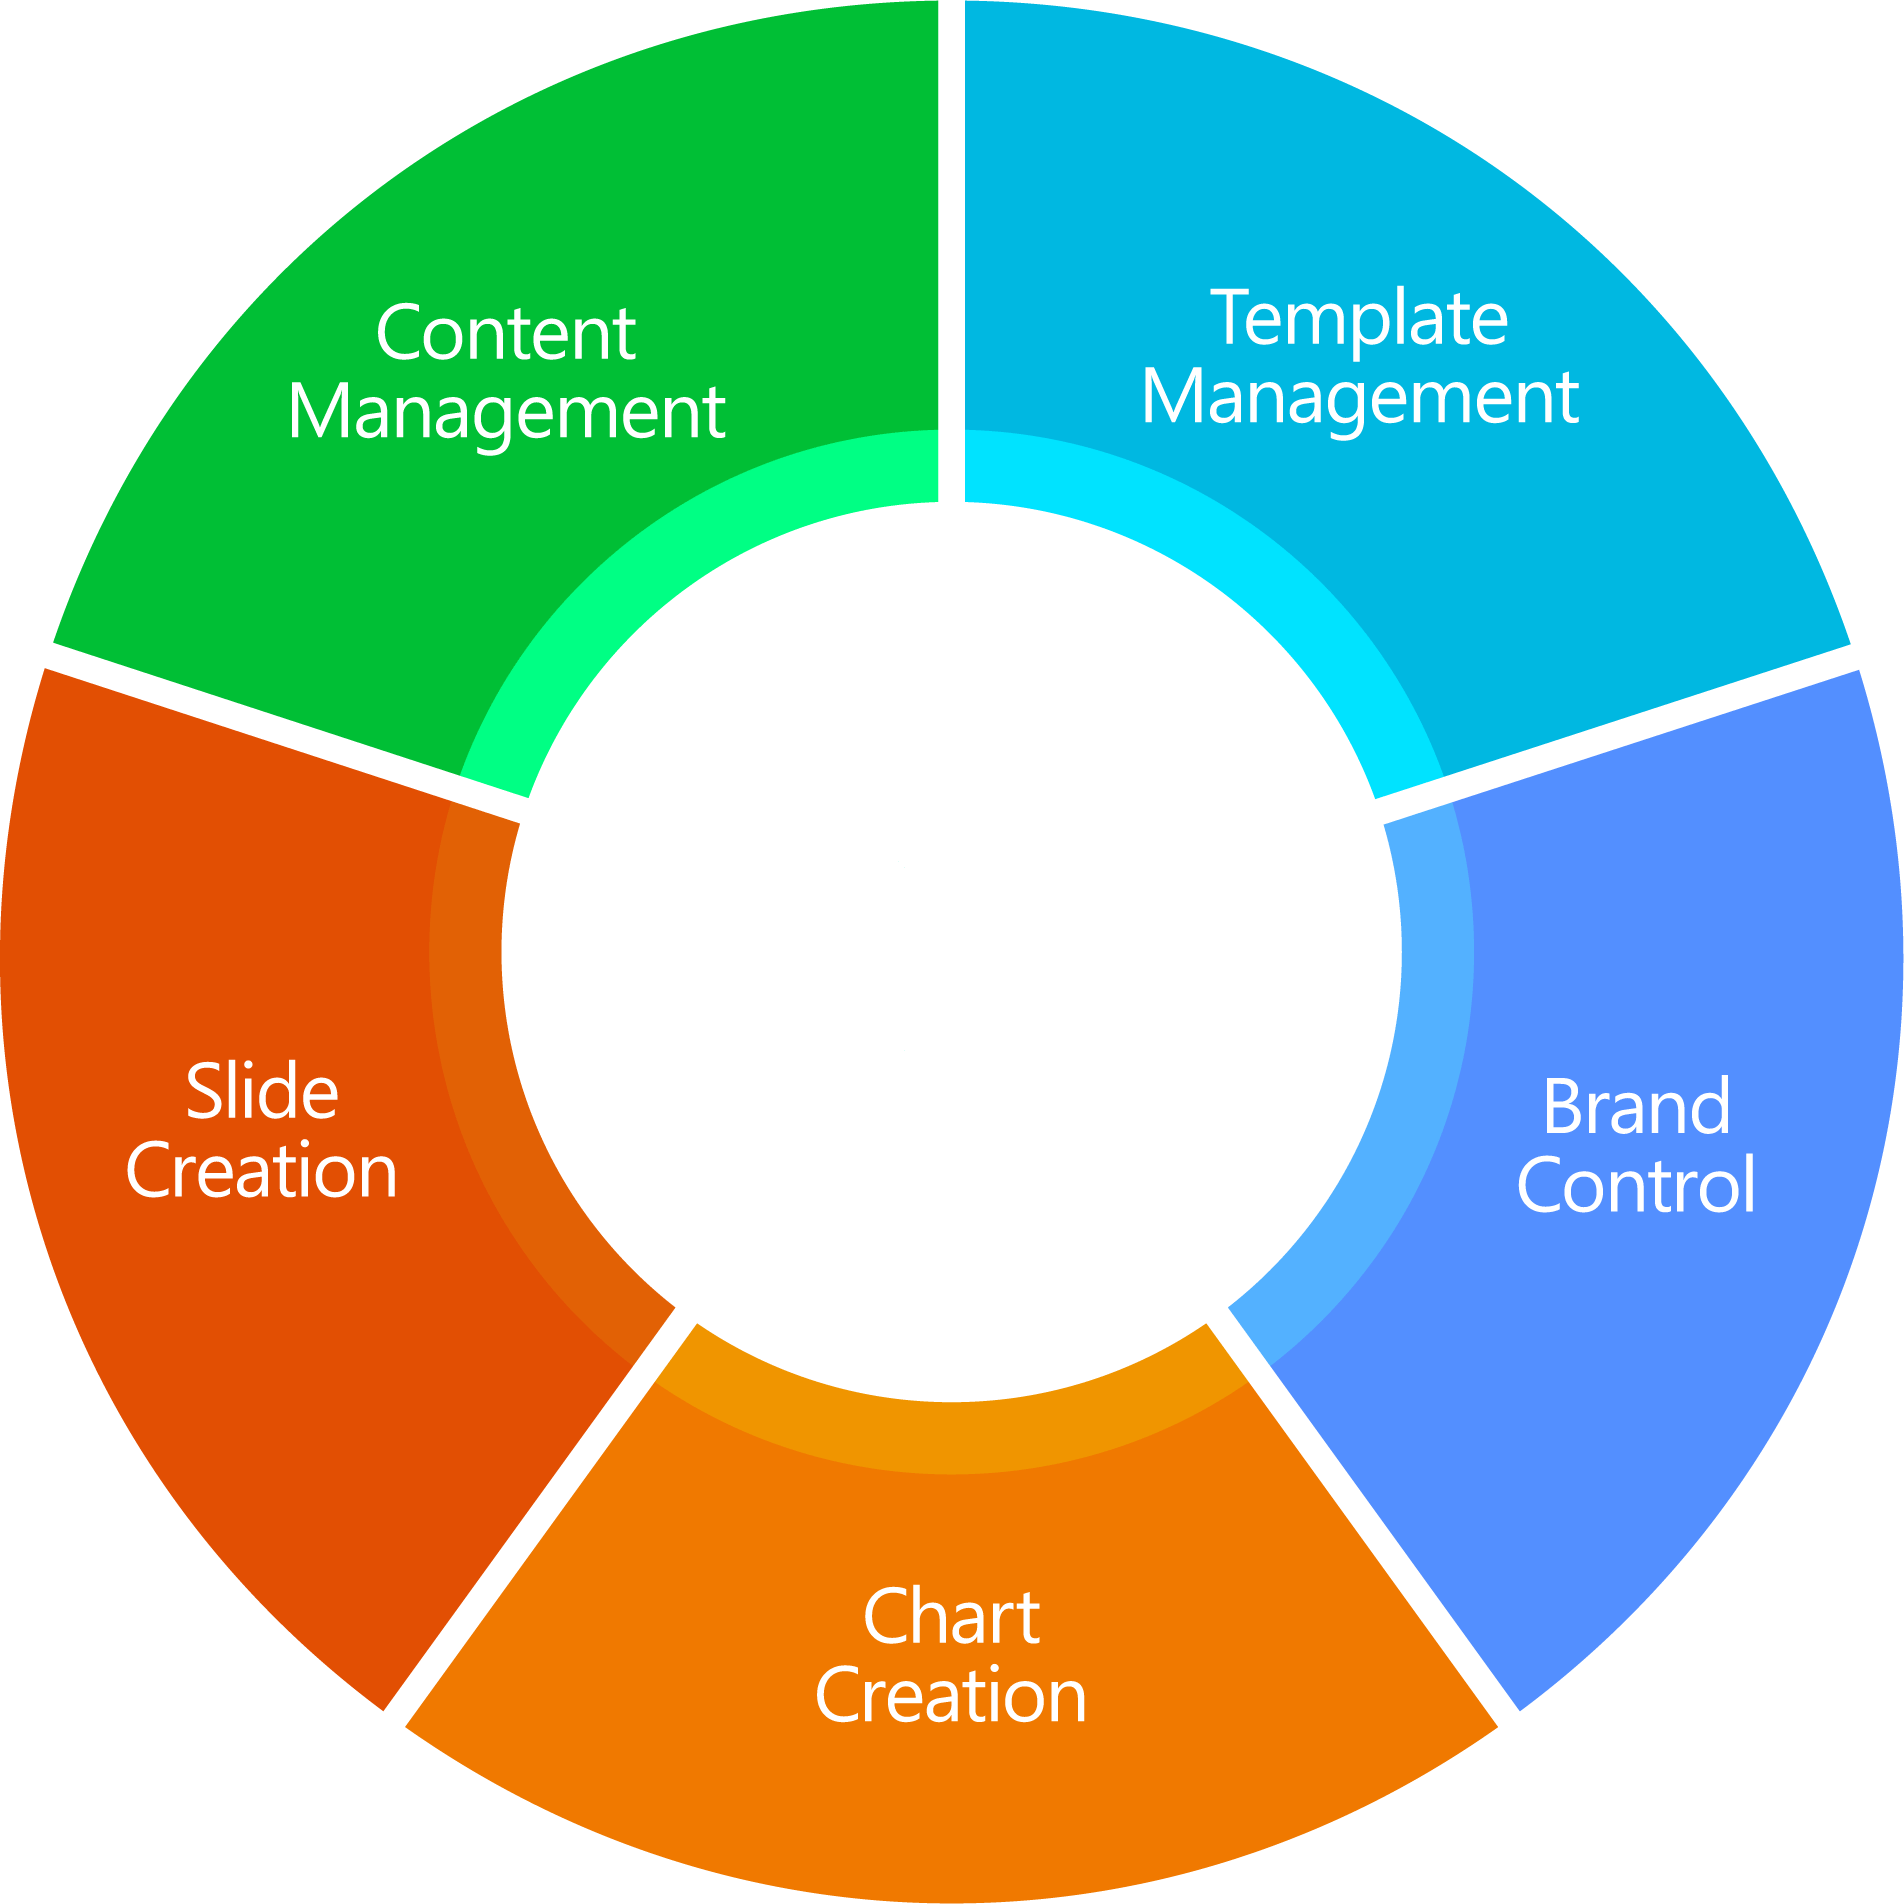
empower® covers everything your company needs to create professional documents - from branding to charting, from content management to automation - enhanced by AI and fully backed by our professional services.
 efficient
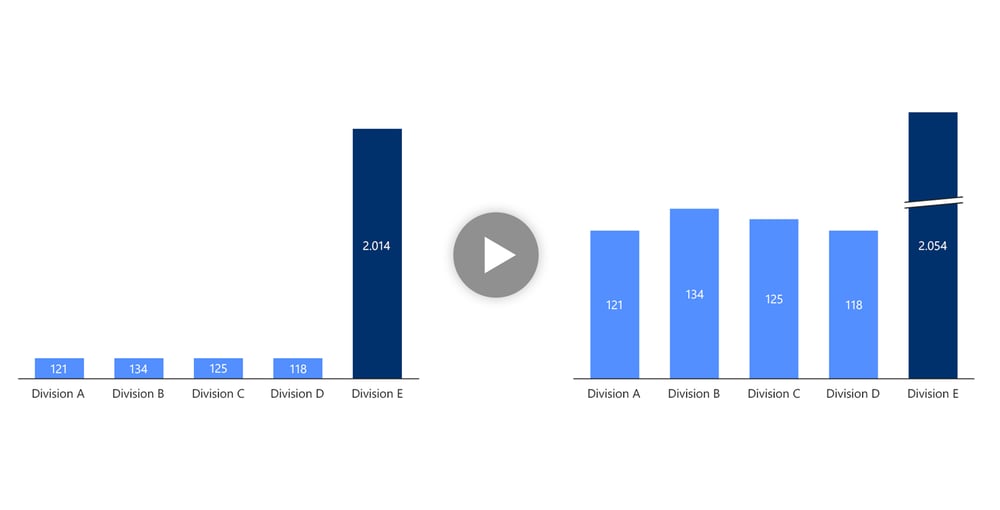
No limits – charts with Arrows, Breaks, and Links to Excel
empower® addresses some important PowerPoint limitations. Have you ever tried to point out key information in your chart, such as the absolute growth or a compound annual growth rate (CAGR)? What about inserting breaks to optically shorten breakaways? empower® for charts in PowerPoint makes those sorts of tasks simple. And you can flexibly link charts to Excel files.
Use one of the predefined numeric formats or define your own custom number format. You can also scale number formats. Number Formats remain stable even when the presentation is opened on a PC with different regional number settings.
Link your charts to Excel files on a local or a network drive, or even in SharePoint or Teams. When using local or network drives, you can link Excel files using Relative Paths.
The data entry window gives you access to tools that quickly reverse or sort the order of series or categories, or rotate (transpose) your chart data. It’s available whenever you edit data for any empower® Chart.
When you have multiple charts on a single slide, make the data comparable by unifying the height and value axis scales for all charts.
Quickly define where you want to show a chart legend. Or use an empower® function to show the data series labels right next to your data.
 brand compliant
100% brand compliance
in every chart
empower® makes your PowerPoint charts look good, and it ensures they comply with your corporate design. During an initial configuration consulting phase, we adapt all chart types to your Corporate Design. People can adjust formatting, but only within approved guidelines. That guarantees your charts always display consistent branding.
Color Picker
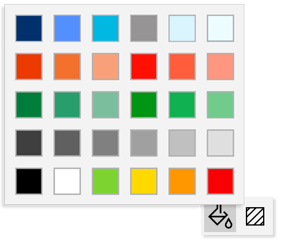
empower® for charts in PowerPoint works with its own Color Picker that can be customized as needed. It simultaneously controls and expands color options by showing only approved colors and enabling more colors than a native PowerPoint theme. That flexibility comes in handy, for example in charts with many data series.
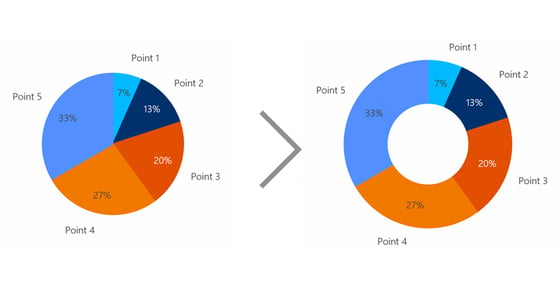
Convert from Old to New
Quickly convert existing PowerPoint charts into empower® to benefit from all the great functionality this charting plug-in offers.
Want to learn more? Directly access the 42-minute demo video and see Chart Creation in action.
- Stop wasting time - experience maximum efficiency when creating presentations.
- Learn how to create complex business charts in a snap.
- See how easily you can automate reports and eliminate formatting tasks.
 IT requirements
Future-proof Enterprise Class Software
empower® for charts in PowerPoint is designed for enterprises of all sizes: from small sophisticated firms to global enterprises with more than 100,000 users. empower® uses state-of-the-art technology and a modern architecture to ensure high performance, stability, and scalability in every situation.
System Requirements
Supports all common Office versions: 2010, 2013, 2016, 2019 and Office 365.
Compatible with all current Windows versions, Citrix, and Terminal Server.
Optimized for Microsoft 365
empower® is optimized for Microsoft 365. Thanks to our close relationship with Microsoft, we can ensure that empower® is compatible with the latest Office releases at any given time.
Download our brochure
All information about empower® at a glance!


.jpg?width=1000&height=510&name=Arrows_button_2%20(1).jpg)
