How to handle common challenges with Excel links and apply best practices
Imagine updating the numbers in Excel and having your PowerPoint report stay current automatically. Excel-linked charts connect PowerPoint to an external data source, so content can be refreshed automatically. This saves time in recurring reports, but it also requires a clean structure, clear processes, and careful handling of data and files.
Where and why to use Excel links
Excel links are useful whenever data is updated regularly and several slides rely on the same data source.
Common use cases include:
-
Monthly and quarterly reporting
-
KPI dashboards for management presentations
-
Finance and controlling reports
-
Sales or marketing performance analyses
To learn how to connect PowerPoint charts to Excel, take a look at our compact guide.
The main benefit is efficiency. Data is maintained once and then used consistently across multiple presentations or slides.
However, Excel links are not the best choice for every presentation. For one-time presentations, external client decks, or files that need to be shared without the source data, embedded charts can be simpler and safer.
👉 Excel links are especially valuable when numbers change often and current data is essential.
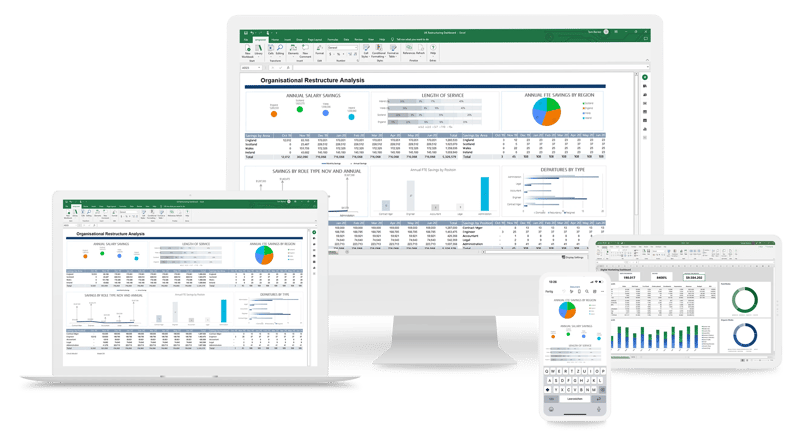
What are Excel-linked charts in PowerPoint?
An Excel-linked chart is a PowerPoint chart whose data is not stored directly in the presentation. Instead, the data is loaded from an external Excel file.
The key difference is the data source:
-
Embedded charts store their data directly in PowerPoint
-
Linked charts pull data from an external Excel file
-
Linked objects can be refreshed when the Excel data changes
This means changes made in Excel can be transferred to PowerPoint automatically, without manually adjusting the chart.
Typical applications include:
-
Charts with a linked Excel data source
-
Tables that refresh in PowerPoint
-
Complete reporting structures based on one central file
Why Excel links can be challenging in practice
The real challenge is not creating the link. It is keeping the link stable over time.
One major issue is technical fragility. PowerPoint stores the path to the Excel file. As soon as that path changes, for example because the file is moved or renamed, the link no longer has a reliable source.
Another issue is the work environment. Different storage locations, network drives, or local files can cause links to behave differently for different users.
Reporting complexity also increases over time. The more slides and charts that rely on one Excel file, the harder it becomes to keep track of everything. Small changes in the data source can have unexpected effects across multiple presentations.
👉 The main challenge is not the feature itself, but the lack of reliability in dynamic work environments.
What to keep in mind when using Excel links
For Excel links to work reliably, you need clear rules for structure and usage.
Important basic principles include:
-
Centralized data storage: Store Excel files in a fixed location that everyone can access
-
Stable structure: Do not change table layouts or data ranges without planning
-
Consistent naming: Use clear, unique file names and labels
-
Defined responsibilities: Decide who maintains and approves the data
A structured workflow is also essential. First, update the relevant data in Excel. Then refresh the links in PowerPoint intentionally, either when opening the file or through the link management function. Before using or sharing the report, briefly review the results to catch outdated data, broken links, or unintended changes early.
👉 Excel links work best when they are not only set up correctly, but also supported by well-organized processes.

4 common mistakes with Excel links in PowerPoint
In practice, problems often come from common work habits rather than the system itself.
1. One common mistake is unknowingly working with outdated data. If links are not actively refreshed, charts remain out of date even though the Excel file has already been updated.
2. Parallel file editing is another critical issue. When several versions of an Excel file are in circulation, presentations may point to different data versions.
3. Another problem is the hidden separation of data. Linked charts are sometimes converted into embedded objects without users noticing. As a result, the refresh logic is lost.
4. Expanding data ranges is also often underestimated. New rows or columns in Excel are not automatically included in existing charts if the reference ranges have not been adjusted.
👉 Many errors develop gradually and remain unnoticed until the numbers are no longer consistent.
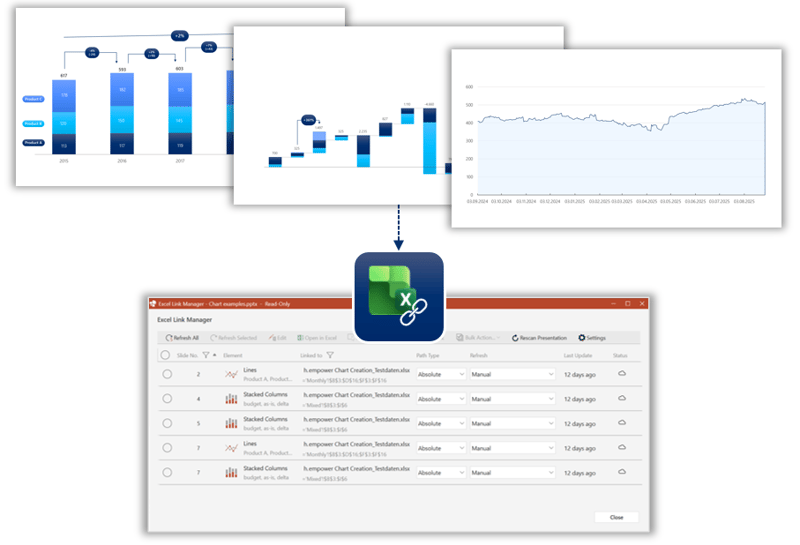
How add-ins make Excel links easier to manage
Charting add-ins can help exactly where native PowerPoint features reach their limits.
They can make working with Excel links much easier by providing a central overview of all links within a presentation. This allows users to refresh multiple charts, tables, or individual linked text elements in a targeted and efficient way. Add-ins can also help create a more stable connection between the data source and PowerPoint and, when needed, refresh links automatically. This reduces the risk of errors when changes are made and makes complex reports more transparent.
The biggest advantage is visibility. You can see which slide is connected to which data source and take targeted action instead of checking links one by one.
👉 Add-ins do not replace a clean data structure, but they do help keep complexity under control.
Conclusion: When Excel links are truly worth it
Excel-linked charts are especially useful for recurring reports with regularly updated data. They support efficient workflows and consistent results across multiple slides.
At the same time, they require disciplined data maintenance, clear structures, and careful handling of files and versions. Only then can they deliver their full value.
Would you like to use Excel links in PowerPoint more reliably and make your reporting processes more efficient? Explore how empower® Chart Creation can help.


Link PPT charts with Excel - How to keep your data up to date!

Create drop-down lists in Excel and improve your data quality