Looking for an advanced charting solution in PowerPoint? Then you’ve likely heard of add-ins like empower® Charts. This article outlines how these tools enhance chart creation in PowerPoint - and what to consider when choosing one.
Explore PowerPoint charting add-ins
Add-ins like empower® Charts streamline the charting process and boost productivity. They make it easy to create professional charts such as Gantt and waterfall charts.
We answer key questions, including:
- What are feature and pricing details?
- Are the tools compatible with Microsoft 365?
- Do they come with tutorials and support?
- How do you introduce empower®?
1. Maintain full cost control
empower offers fair terms and an extremely attractive licensing model for corporate licenses. As a result:
- You always maintain full cost control
- You make all users more productive
- You ensure that all users create professional results
The empower licensing model also minimizes license management effort because:
- License keys run indefinitely and don’t require annual renewal
- Unused licenses are automatically transferred into a pool and re-assigned
- Unexpected additional license needs can be covered through a license buffer
2. Quickly build Gantt, Waterfall, and more
empower® lets you build powerful charts in minutes - from simple bars and lines to complex visuals like Gantt and waterfall charts. Stacked bar charts can be created effortlessly. Display multiple data series as grouped or stacked bars, show totals, connectors, or percentages, and add arrows or breaks to emphasize key data points.

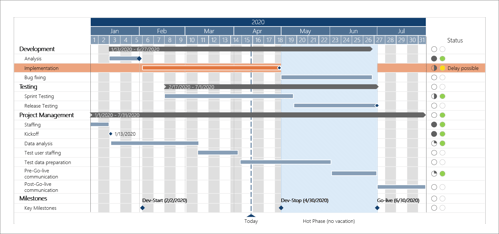
Gantt charts come with features like project phase grouping, optional visibility settings, and the ability to display holidays or deadlines. If a project timeline shifts, you can easily update the chart with a single input.

With empower®, you can also create waterfall charts dead easy. You can even insert subtotals per data series or show multiple waterfalls in a single chart. You can let waterfall charts grow from left to right, or right to left. Both vertical and horizontal waterfall charts are also supported.
3. Work smart with templates and visual tools
With empower®, users do much more than just create charts in PowerPoint: modern AI features, automatic presentation creation, a templates and content library, and many productivity functions make everyday work easier. Access your image database or search Unsplash - all directly from PowerPoint. In addition, empower supports users in Word, Outlook, and Excel to quickly create professional documents.
empower® is an all-in-one suite that enables customers to replace many typical Microsoft 365 add-ins.
4. Trusted Microsoft partnership
As a Microsoft partner, empower® ensures full compatibility with Microsoft 365. Through the Microsoft Compatibility Lab, it guarantees reliable updates. Microsoft itself is among empower®’s clients.

5. Seamlessly convert existing charts
Worried about old charts? empower® Charts features a conversion tool that updates individual or multiple charts into its format - automatically applying your corporate design.

Free trial and proof-of-concept available
Try empower® for free or start with a low-cost proof-of-concept project, where the software is tailored to your brand, a pilot group receives training, and a feedback survey evaluates the rollout. Throughout the trial and beyond, expert support ensures a smooth transition and operation.
Interested in empower® Charts or ready to test it out? Contact us today - we’re here to help.
