


Waterfall diagrams are often used to represent a temporal evolution. In empower® Charts you have the option of viewing a waterfall diagram backwards. This function makes it possible to break down a sum into its individual components.
We illustrate the function using an example
You want to differentiate the expenditures of your company. You have a total of 1.000 Euro of expenditure. How does this amount come about? A waterfall diagram is well suited for the visual representation of this scenario. The sum is broken down into its individual components (A, B, C, D).
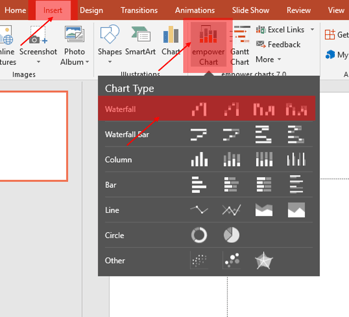
- First insert a waterfall diagram into PowerPoint. Click on “Insert" and “empower® Chart" and select “Waterfall".
Now a prefabricated diagram is inserted.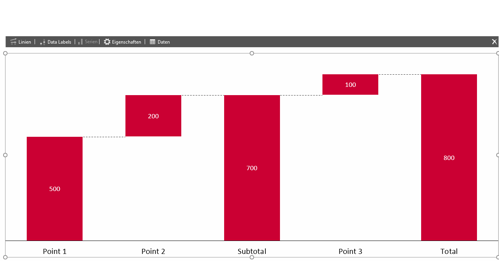
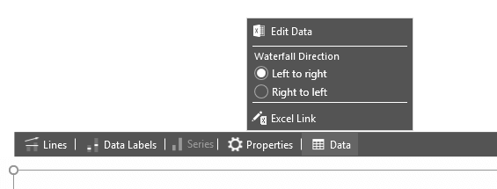
- To edit the contained data, click on “Data" in the action bar and open “Edit data".
- The Excel table of the diagram opens, here you can now enter the desired values and labeling. According to the above example, this looks as follows:
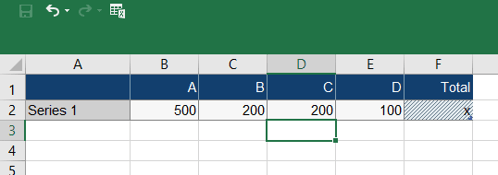
- Place the positive values in the table; at the end the total is built with the special value x.
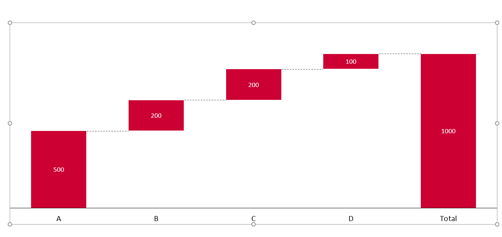
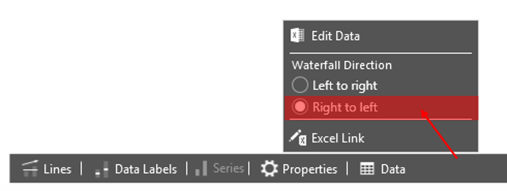
The diagram is now presented in the form of a temporal development. - Since you do not want to represent a temporal development, but parts of a sum, you should change the direction of the waterfall. This makes empower® Charts possible with just one click. To do this, click on “Data" again. Then click on Waterfall Direction “Right to Left".
The diagram is now displayed in descending order, starting from the sum. As already mentioned, this is practical whenever the composition of a sum is to be explained.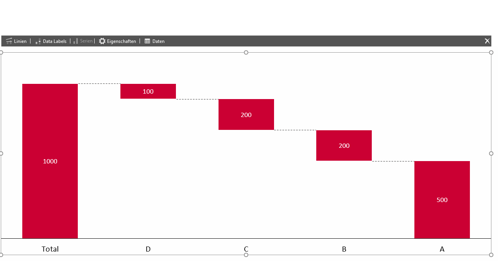

Next article
Create your own shortcuts in Microsoft Word →
How to create a waterfall chart? A step by step guide

How to create a waterfall chart? A step by step guide
March 23, 2026
8
min read
Presenting plan vs. actual variances in presentations

Presenting plan vs. actual variances in presentations
April 29, 2026
4
min read
Creating waterfall charts in PowerPoint: Make changes easy to understand

Creating waterfall charts in PowerPoint: Make changes easy to understand
March 31, 2026
7
min read