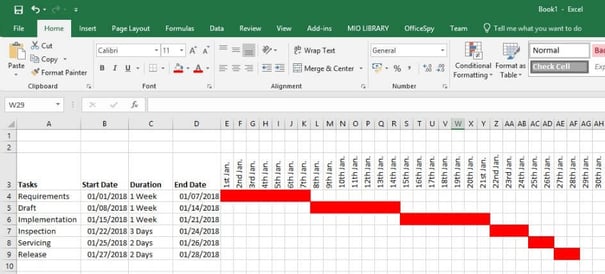
A Gantt chart displays a chronological order of activities. It is frequently used to plan projects and to generate a visual timeline. In this Office tip, we want to show you how to create a Gantt chart in Excel in 8 steps.
How to create a Gantt chart in Excel
- Create the outlines
Create a table that displays the exact outline of your project. Do you need to switch your rows and columns? We recommend that you enter all task stages of your project including start date, duration, and end date. See to use current data and refresh your table if you use web-based data in your chart.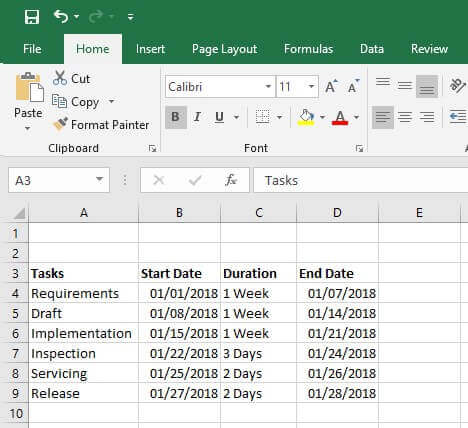
- Choose the time span
Add the complete time span of your project to this table. To do so, enter the individual dates as table headers.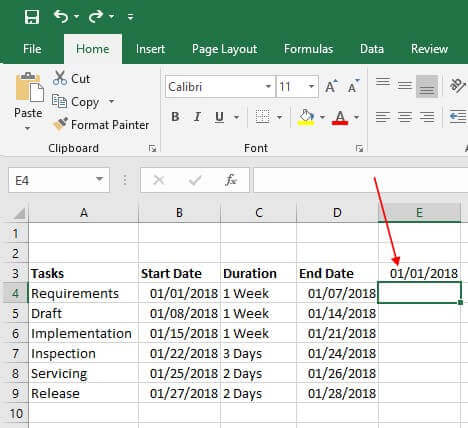
- Choose your preferred style for the dates
Format your starting date. Click right on the date and select “Format cell”. Choosing “Numbers” select your preferred option in the date section.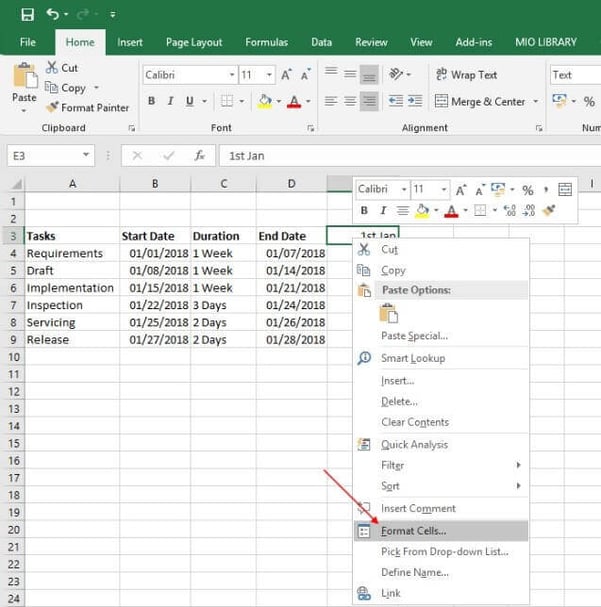 Next, change the design by clicking on “Home” and then on “ab”. Select the option to rotate the text up.
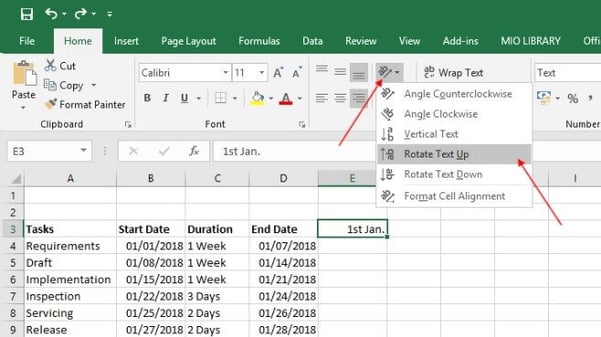
- Create a design you like
Click on the date you just created. Then, click in the bottom left corner and drag the cursor to the right until you have the correct number of days for the duration of your project.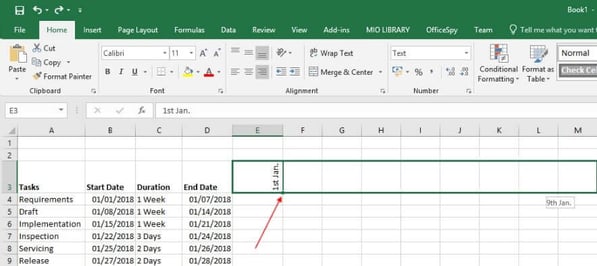

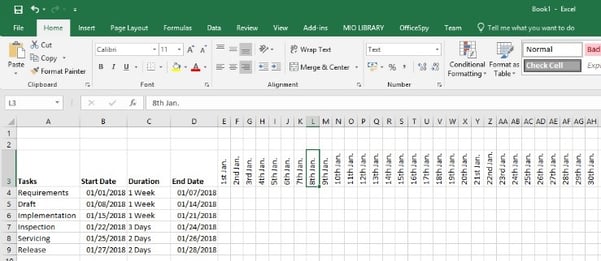
- Finish the timeline
Select the complete time span by selecting the top cells (E, F, …) and reducing the size of these individual boxes. To do so, click on the vertical lines between the selected cells and drag them to the desired size.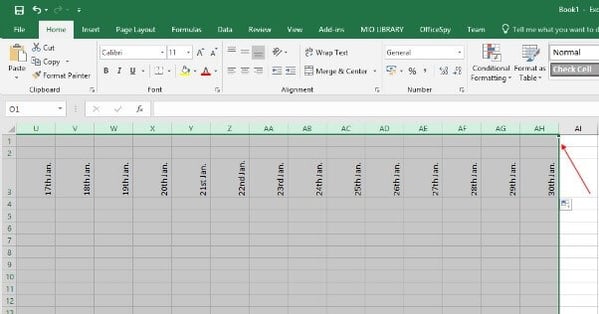
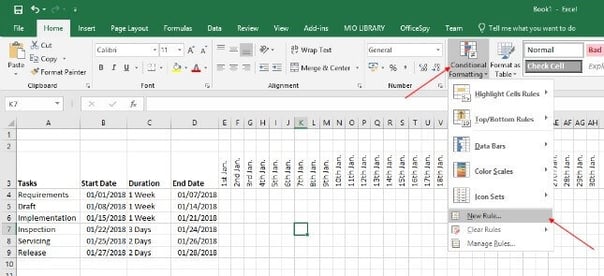
- Add conditional formatting
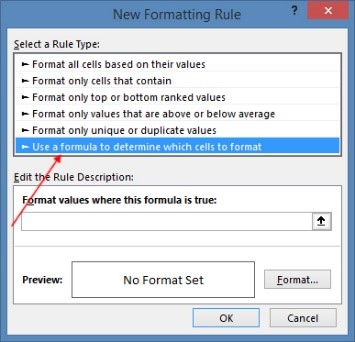
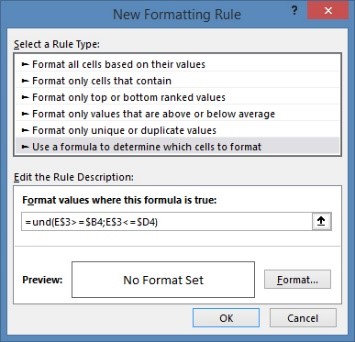
Select the relevant cells that are to receive this formatting. In the “Home” menu click on “Conditional formatting” and select “New rule”. Choose a customized formula as your rule type.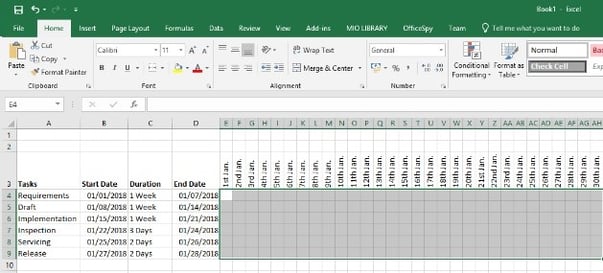
- Enter an “AND formula” with two conditions.
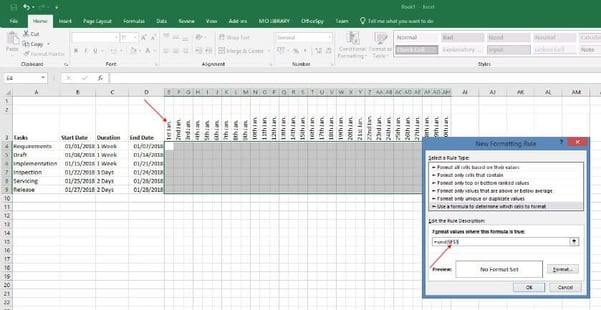
Begin with “=and( “. Now click on the cell containing the first date of your headers. The formula will appear in the editing bar. For example, for Cell D3 (=$D$3). The value in this cell has to be equal to or higher than the start date. To enter this, type “>=” and then click on the cell that contains the start date. The name of this cell will now be entered automatically.
Now enter “;” and repeat the procedure for the end date: Click on the cell containing the first date of the headers. The name of this cell should appear. It will have to be smaller than the end date. For that, enter “<=” in the formula and click on the cell containing the end date. To complete the formula, close the bracket and delete the first, fourth, fifth and eighth dollar symbol (“$”) from this formula.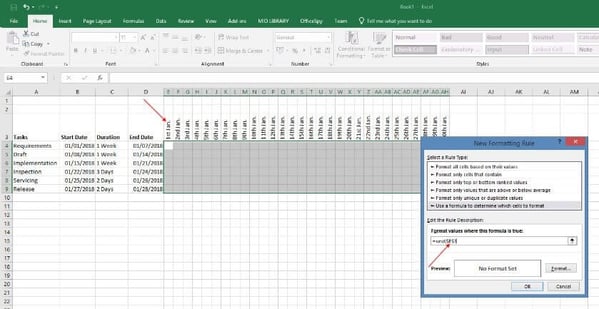
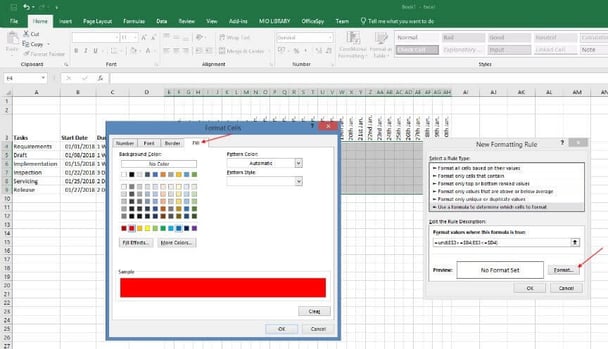
- Add colored bars
Set a format that reflects the formula by clicking on “Format” and selecting a color you wish to display the bars of your Gantt chart. You have now created a Gantt chart following simple steps. It can dynamically adapt to changes and additions automatically. Coloring the chart in your corporate design colors will demonstrate good brand control and as such, we recommend it highly.
Insert Gantt chart into your PowerPoint presentation
Copy the entire Excel table into your desired PowerPoint presentation: Select the table, open the context menu with a right click, and choose "Copy". In your PowerPoint presentation, select the desired slide, select a content placeholder and choose "Insert" from the context menu. Now you can present your project visually and make your plans more convincing. Not sure if Gantt is the right chart for your report? Check out our article on how to create diagrams without designated charting software
Did that take too long?
Want to create a Gantt charts easier and faster? With empower® for PowerPoint Charts, we made it possible to create elegant Gantt charts directly in PowerPoint, via drag & drop and in your corporate design. Make sure to read more about our powerful charting and layout software.
Do you wonder which PowerPoint chart is most suitable for your purpose? Then check out our list of the 10 most useful PowerPoint charts. If you're specifically interested in what else you can do with Gantt charts, we collected many useful Gantt chart examples.
Did you know that you can easily swap rows and columns in Excel? Find out this and many more tips and tricks in our Microsoft 365 guide.

Gantt chart examples for your projects

Creating Gantt Charts in PowerPoint for clear and professional project planning