Do you want to better organize your next project and create a professional schedule? Then almost certainly you have come across the topic of Gantt charts.
If you have never created a Gantt chart before, or you were not satisfied with your previous Gantt creations, you have come to the right place.
Before we show you how to create an example Gantt chart step by step, we will go over the different purposes of a Gantt chart and its benefits for your team and your project.
Gantt chart example
A Gantt chart is a popular project management tool for visualizing the time sequence of tasks - from start to completion of a project.
What are the biggest problems in project management?
It can be extremely difficult to keep track of all project requirements and activities. That is specially true when managing large projects with many overlapping tasks.
During a project, it is important that all parties communicate clearly and coordinate smoothly. An accessible timeline using a Gantt chart offers a simple solution.
Gantt chart examples for different purposes
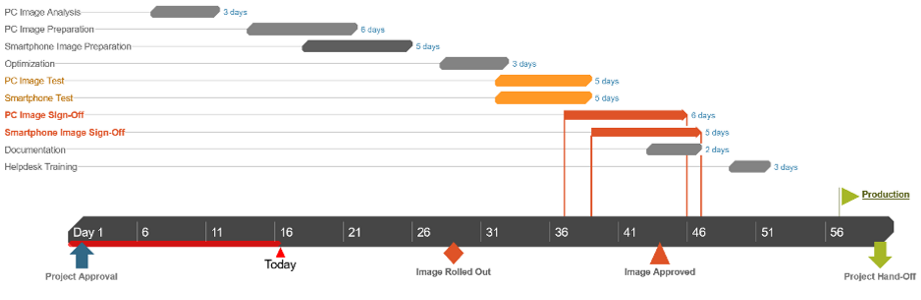
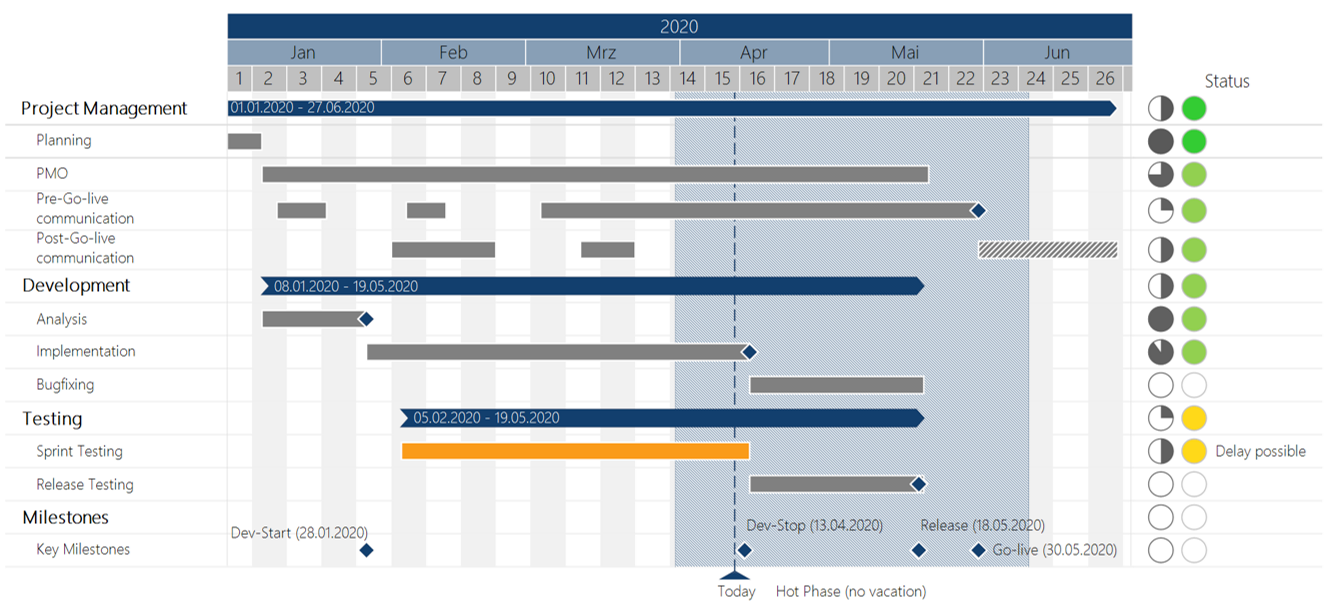
Software development
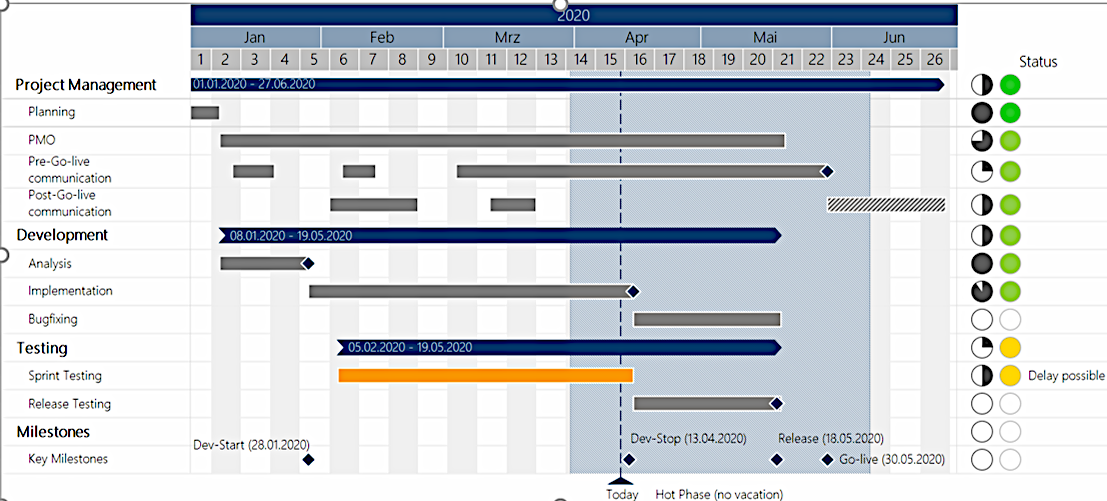
Gantt chart example for project management in IT. Uses color codes to indicate the status of tasks.
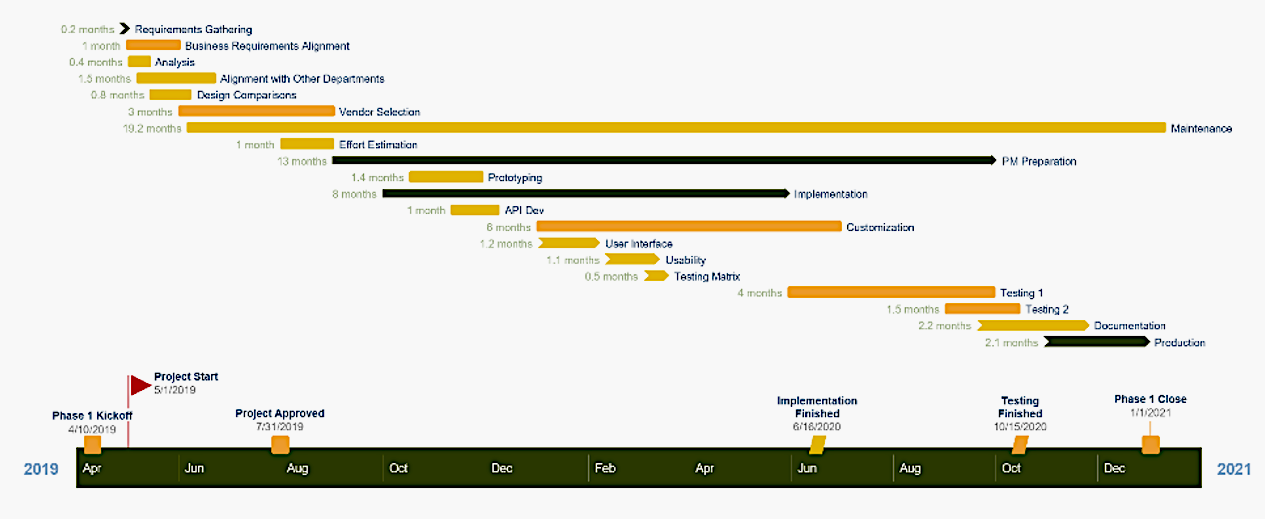
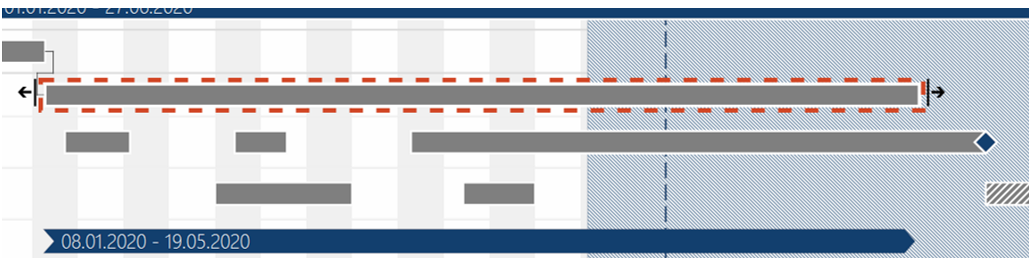
Program Management
Program management Gantt chart with thin taskbars. It shows enough details while avoiding complexity.
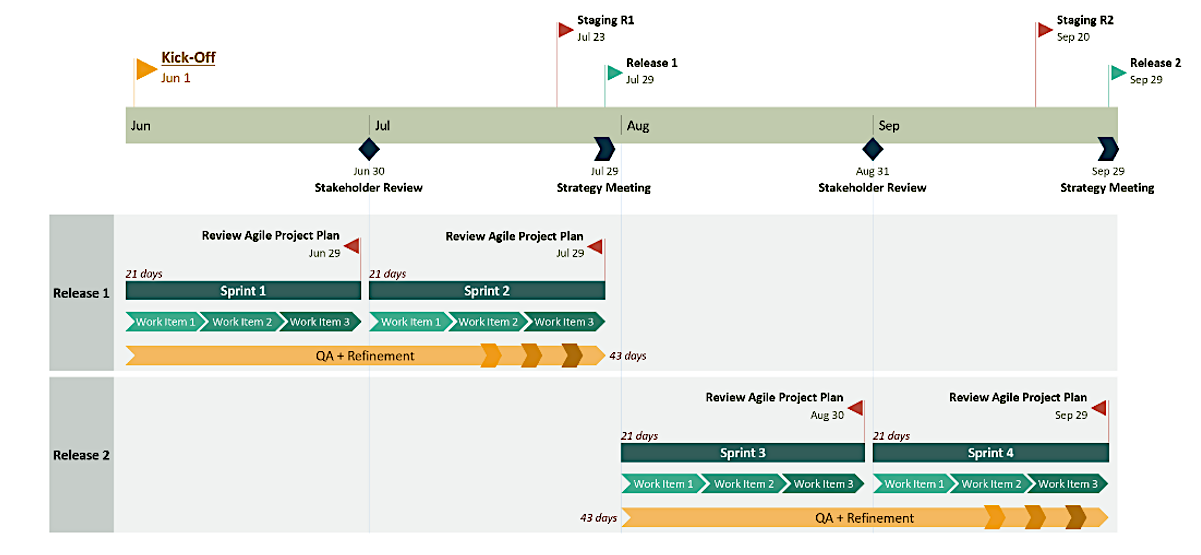
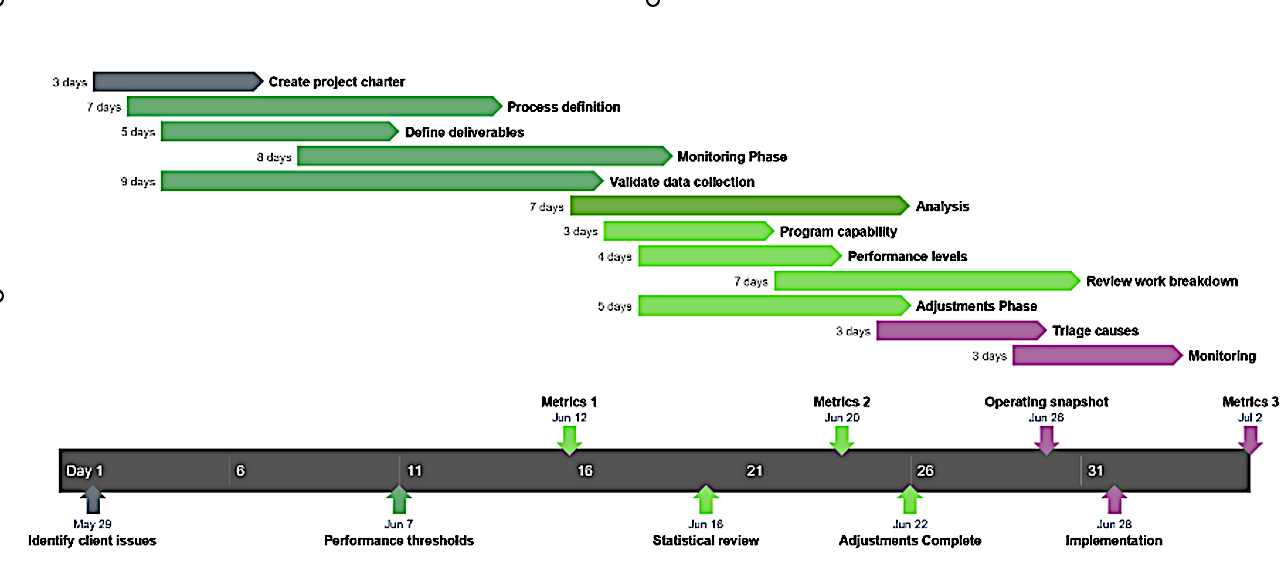
Agile Gantt chart
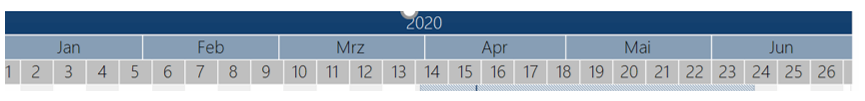
Example of a generic Gantt chart with a time scale in days and tasks divided into phases for agile project management.
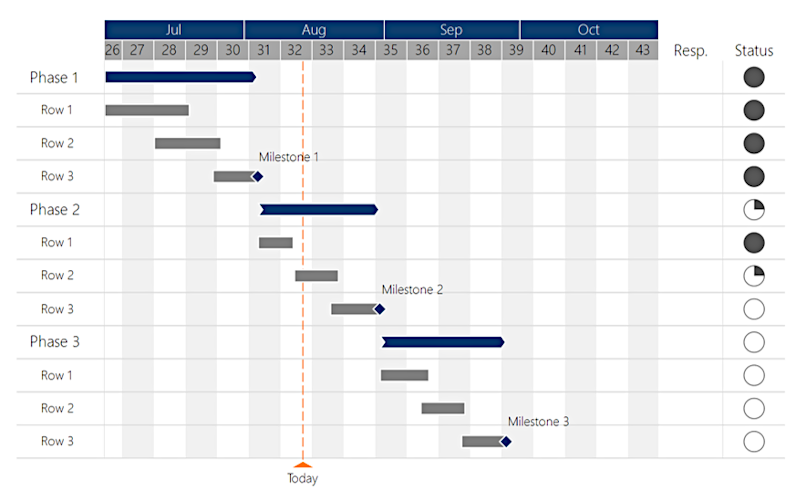
Project overview
Stylish Gantt chart example for professionals to visually support project reviews or proposals.
A Gantt chart offers you these advantages
- See what needs to be done and when.
- A Gantt chart always follows the same format, which is why you can use a universal template for different projects
- Plan, organize, and monitor simple or complex projects
- Keep stakeholders and customers informed of deadlines and progress.
- Maintain a detailed visual reference for project managers and team members.
Gantt chart example in three steps
Best practice: The following 3 steps will show you how to successfully implement the planning of your next project using a Gantt chart example.
Step 1: Initial considerations / Identify individual tasks
Consider exactly which activities will be required and how long each will take. Set realistic deadlines for your project and for individual tasks (allow for likely delays). For international projects, remember to consider other countries' national holidays. This is probably the most difficult step because most tasks also have subtasks.
You should identify dependencies precisely - which activities must be completed before another task can start. When you understand exactly what sequence must be followed, you can determine which tasks can be performed simultaneously and which must be performed sequentially.
Tip: Involve teammates to help identify main tasks and subtasks.
For this task list you can first use a simple table. If the data is stored online, there is a possibility to import web data into Excel.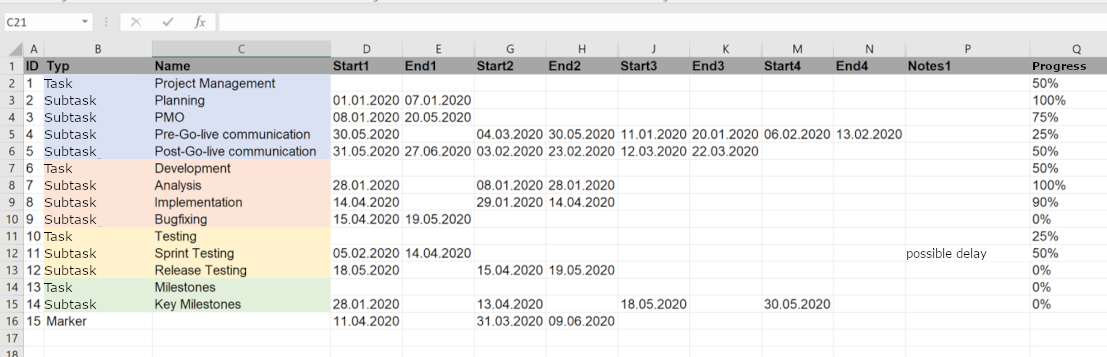
Step 2: Enter information into your chart
Use a Gantt chart template or creation software to enter project information into your chart. Make sure that all tasks and dependencies are included.
Components of a Gantt chart
- Gantt bars: Gantt bars visually represent a task. These bars show the duration of a task as well as the task type - e.g. milestones or critical. In addition, Gantt bars can show the progress of a task as a percentage, as well as time buffers and details of planned and actual start and end dates.
- Time frame: The time frame defines the time intervals within the diagram - hours, days, weeks, etc. Specific dates, usually located at the top of the diagram, indicate expected start and end dates of individual tasks as well as the entire project.
- Milestones: Milestones are important target dates or fixed points of a project. They are usually associated with the completion of a task.

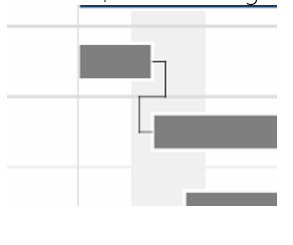
- Dependencies: Consider here especially the dependencies described in point 1, in other words the correct sequence of the various tasks. A Gantt chart assumes the principle of simultaneous engineering. This means that an overlapping course of activities should be developed as far as possible.
Step 3: Update the chart as the project progresses.
Your Gantt chart should always be up-to-date. Therefore, make sure to update your chart frequently regarding completed tasks, changed deadlines, and changes in responsibilities. With an updated Gantt chart, your team will be able to react much more flexibly to new circumstances as the project progresses.
Good to know about Gantt Charts
Buffer
A buffer time is a period of time by which an activity may be delayed without delaying the completion of the project. Just like adding time buffers in your Outlook calendar for a bit of downtime between meetings, this will lead to less stress for your employees doing the project.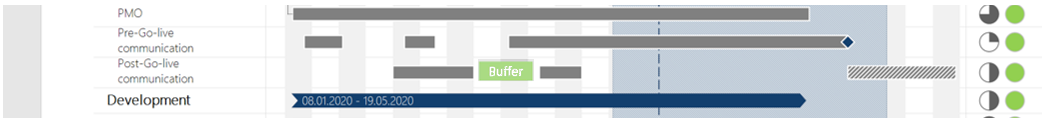
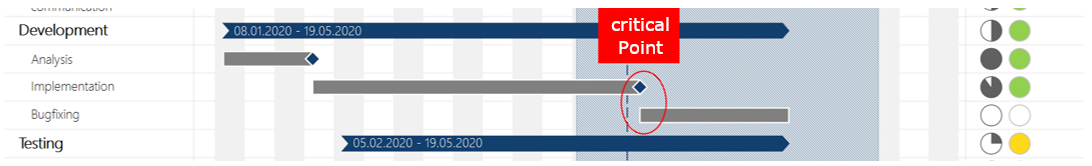
Critical points
This means that an extension of the activity will increase total duration. For example, if transporting boxes and furniture takes longer than the assumed hour, all subsequent tasks will be postponed, and the total time of the move will increase.
Plan projects and visualize your schedules
Do you want to start working with your own Gantt chart, be it for a small project or a multi-year roadmap? Pick a suitable tool first. With empower® Charts you can create Gantt charts in a few minutes and with a few clicks, directly in PowerPoint and almost entirely automatically. empower® makes it easy to create and update your schedule with status, responsibilities, vacation calendars, school vacations, and other elements. Want to create other charts? Learn how to create charts without external software!
empower® offers more extensive features for Gantt charts: collapsible project phases, vacation calendar, visual project delays. Also, creation is often faster:
- 35% fewer clicks
- 61% less mouse movement
- 29 % faster
Feel free to contact us with any questions about our Gantt chart solution.

Creating Gantt Charts in PowerPoint for clear and professional project planning

Create a Gantt chart in Excel in 8 steps