Simplify Chart Creation
Create perfect charts effortlessly
Over 3 million people already trust empower® to create professional Office documents.
Wasting Time?
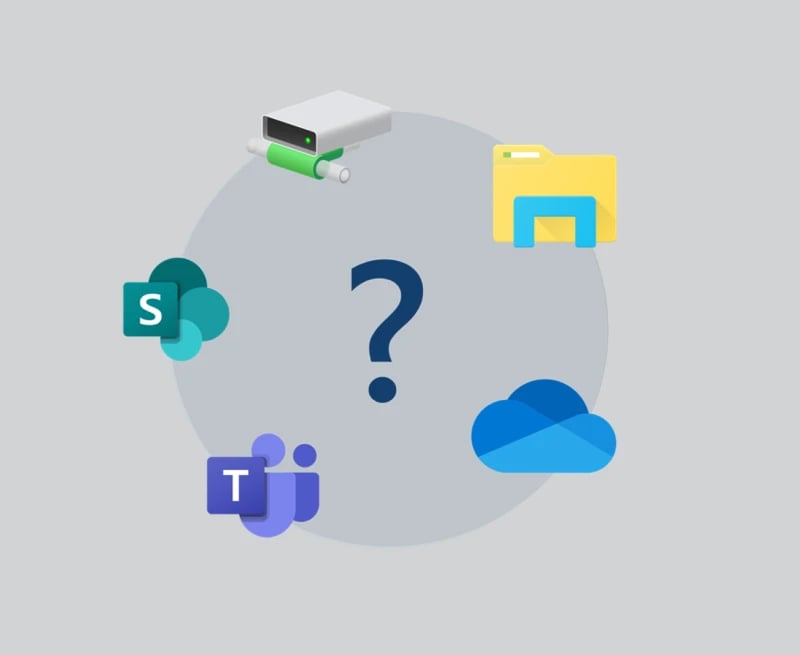
- Having trouble with presentation management?
- Slides scattered across different platforms and folders?
- Irrelevant or outdated content cluttering up your search results?
Doubting Your Slides?

- Is outdated content damaging your reputation?
- Numerous versions of slides circulating in the company?
- Constantly recreating slides because you can't find the latest version?
A Slide Library you can trust...
Easily manage PowerPoint slides company-wide with the innovative Slide Library from empower®
 Challenge
What's the most time-consuming task in PowerPoint?
Creating charts.
68% of users
find it frustrating and slow.
Endless formatting leads to stress - not standout visuals.
Struggling with charts makes it easy to lose sight of your message.
You miss the point - turning complex data into clear insights.
Want to bring numbers to life? You need a faster, smarter way to create charts.
With empower®, you build compelling charts in minutes - for presentations that make an impact.
*Source: These data come from our 2025 Office Study, conducted by Kantar on behalf of empower, based on a survey of more than 1,000 U.S. employees.
Chart Creation in PowerPoint
15 reasons why empower® is the modern solution.
 Solution
Create flawless charts with ease
Auto-updating reports, without the hassle
Excel link problems affect 65% of employees. With empower®, you eliminate link chaos by connecting charts and text cleanly to Excel. Manage everything centrally with the Excel Link Manager, and keep data updated automatically – for clarity, control, and confidence.
Bye bye, Formatierungsaufwand!
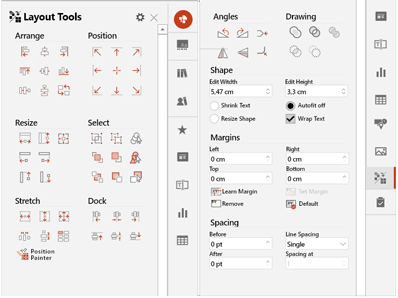
Monotone Aufgaben führen zu monotonem Alltag anstatt zu Motivation und Effizienz. Formatieren Sie Ihre Präsentationen in Sekundenschnelle. Anordnen, positionieren, skalieren oder ausrichten - was mit PowerPoint jedes Mal ewig dauert, ist mit empower® in wenigen Handgriffen erledigt.
Autokorrektur für Flüchtigkeitsfehler
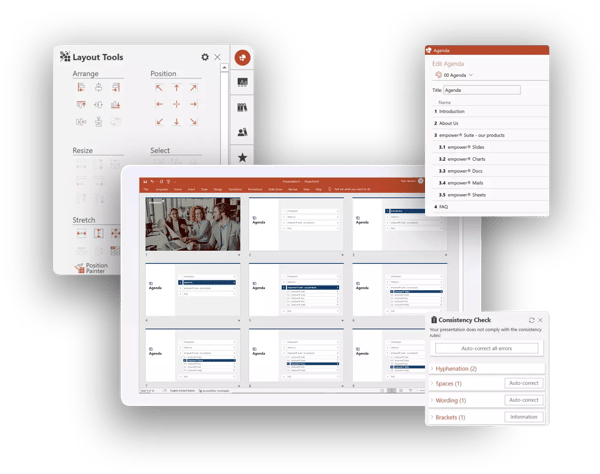
Klammer nicht geschlossen? Doppelte Leerzeichen? Punkt vergessen? Die Silbentrennung mal mit, mal ohne Bindestrich? Und der Markenname ist auch wieder falsch geschrieben? empower® erkennt und korrigert Flüchtigkeitsfehler automatisch. Anwendende erstellen bessere Ergebnisse ohne Prüfungsaufwand in kürzerer Zeit.
Hochpräzise Übersetzungen mit DeepL
empower® verfügt über eine Integration mit dem KI-basierten Übersetzer DeepL, der selbst die kleinsten Nuancen Ihrer Inhalte erkennt und sie nahtlos in eine andere Sprache übersetzt. So geht nichts Entscheidendes verloren und Sie teilen Ihre Botschaft mit der ganzen Welt.
AI-Assistant: Text erstellen & optimieren
Die Erstellung und Optimierung von Text ist die größte Stärke künstlicher Intelligenz. Mit dem empower AI-Assistant integrieren Sie sie direkt in PowerPoint. Besonders praktisch: der AI-Assistant springt mit Ihnen automatisch von Folie zu Folie, von Form zu Form und sie erstellen und verbessern Text per Knopfdruck über voreingestellte Prompts. Das spart unzählige Klicks und führt zu perfekten Texten in kürzerer Zeit.

Create professional charts with advanced elements like breaks, lines, CAGR, and delta arrows. Arrows and value lines are customizable and can be recolored to match your desired style.
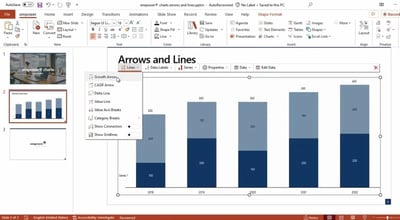
Combine column, bar, and line charts. Differently scaled data series can be merged in a single chart using a secondary value axis.
Link charts to Excel files stored locally, on a network drive, or in SharePoint/Teams. For local or network drives, relative path references can be used, ensuring that Excel links remain active even when the PowerPoint and Excel file pair is moved to a different location. With a single click, data series or categories can be transposed, sorted, or moved within the chart data.
When using multiple charts on a single slide, you can ensure data comparability by adjusting the heights and value axis scales of all charts at the push of a button.
AI Assistant for effortless writing
Get writing help right inside PowerPoint. Whether you're drafting, shortening, or refining text, the empower® AI Assistant moves seamlessly from slide to slide. Less clicking, more clarity – faster.
Learn more
The details that make all the difference
Saving one or multiple slides from a presentation or sharing them via email typically requires 2–3 interface switches and around 20 clicks. With empower’s “Share” function, users stay on one interface and need only 10 clicks. This saves time, simplifies the process, and helps users stay focused on what matters most.
Harvey balls, stamps, checkboxes, symbols, and special characters simplify report comprehension. empower® Chart Creation provides quick access to all these elements, which can be easily and precisely customized to enhance clarity and impact in presentations.
Select your presentation’s language with one click to ensure the spell check reviews it based on the predefined language setting.
A Slide Library Built for Growth and Efficiency
The best alternative to the Microsoft SharePoint slide library
SharePoint is often used for slide management in companies. However, with SharePoint 2013, Microsoft abolished the slide library component because of poor customer adoption. SharePoint’s slide library integrated clumsily with the slide library in PowerPoint, its search was insufficient search, and it was unstable. The slide library of empower® solves all those problems. It completely replaces your SharePoint slide library and offers further advantages for you.
Efficient slide library without SharePoint
Make all your PowerPoint content available to the entire company in the empower® slide library. Share existing content and strengthen collaboration across the organization. Enhance your brand communication by embedding your design guidelines directly into PowerPoint. Deliver all your brand assets directly in PowerPoint. At the same time, you and your colleagues can work more productively and save time for the really important tasks.
A Slide Library that can grow with you
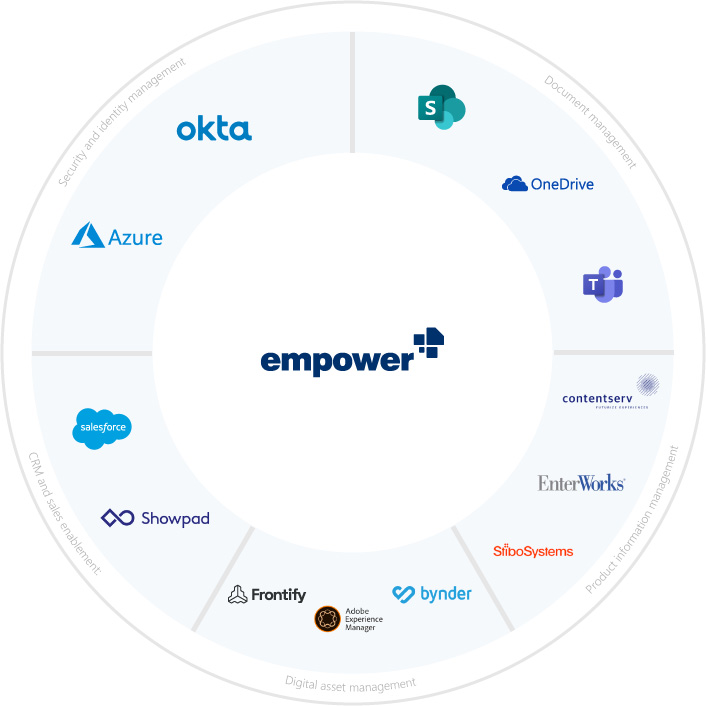
Our empower® slide library is designed to be flexible and grow with your organization. It integrates with other platforms like Sharpoint, Teams and other Digital Asset Management Systems and can be expanded with optional empower features as needed.
Auto-Translations
empower® integrates with DeepL, an AI-based translator that detects even the smallest nuances of your content and seamlessly translates it to another language. Nothing crucial gets lost and you’re sharing your story across the globe.
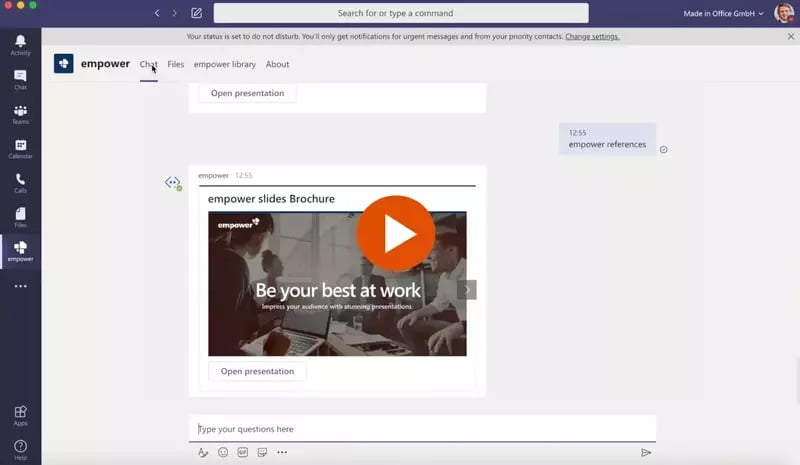
empower® Library explained in one minute

Ready to simplify slide management? Watch our demo video and see how empower® can transform your workflow:
- Find the perfect slide in seconds
- Always have the latest content
- Work seamlessly with PowerPoint
- Access slides anytime, anywhere
Fill out the form and see the empower® slide Library in action.
Do you want to experience empower® for yourself?
Explore all features with our interactive product tour or watch a recorded demo of the software.
Technical Information
Since this is a local add-in, there is no connection to a cloud. Only license activation requires an external connection. To meet the highest security standards, empower GmbH is ISO 27001 certified.
empower® Chart Creation is a fully local add-in for Windows, delivered through standard software deployment as an .msi or .exe package. empower is currently developing a native add-in for macOS.
Each empower® user requires a license. A new license is activated with us if it is a previously not known Windows domain user. To activate the license, an active internet connection is required. Our activation server can be reached at activate.empowersuite.com via port 443. This connection must first be allowed through a proxy (and, if applicable, a firewall).
Find more technical information in the empower® Tech Brief (Help Center).
 Pricing
empower® Chart Creation pricing is determined by the number of licenses, with one license required per user. Each user can access the software on multiple devices. No additional fees apply for administrative users.
Customers who subscribe to multiple empower® solutions or the full empower® Suite receive discounted package pricing. empower also offers enterprise licenses at highly competitive rates.
The table below provides example pricing points. For a customized quote, please contact us or use our pricing configurator. If you need fewer than 50 licenses and are primarily interested in a slide library for Microsoft PowerPoint, we recommend exploring empower® Express.
For a customised quote, please contact us directly or use our pricing calculator.
Monthly prices are rounded to the second decimal place. All prices are non-binding and subject to change. Billing is done annually in advance. Please note that one-time setup costs typically range between $920 and $3,450. Depending on the level of additional support required, customized setup packages can be offered.
 Implementation
Welcome to the empower®experience: seamless implementation and onboarding
Our dedicated onboarding team is here to guide you through the entire process. Below, we’ve outlined the key steps and milestones to ensure a successful user adoption:
- You send us the chart styles and color palette required for setup. We will review the contents for completeness and inform you of the setup timeframe. Typically, this takes 1 to 3 weeks, depending on the scope of the setup.
- After the setup is complete and a revision cycle is finished, you will receive the prepared installation file along with technical documentation.
- Brief coordination with your IT department for technical preparation.
- Planning and inviting users to online training sessions.
- Your IT department deploys the software via your company’s software distribution platform. We provide technical support if needed.
- Users who receive the software participate in the online training or watch the recorded session and review the provided support materials.
- Measuring software usage through telemetry data.
- Planning specialized training sessions on specific topics to ensure maximum user adoption.
- We stay engaged until your expectations for the software are fully met.
Depending on the size of your organization, the software rollout takes 1-3 months.
Step 1:
- For the design setup, a designated person is needed to send us the company's chart styles and color palette and answer any related questions. This process takes approximately 1–2 hours.
- After the setup, this person will review the software’s visual appearance and officially approve it for use. This step also takes approximately 1–2 hours.
Step 2:
- The project lead invites all users to online training sessions and communicates key information about the new software in advance. This takes about 1 hour.
- The IT department deploys the software. While the actual deployment time is minimal, it may vary depending on verification procedures, outsourcing of software installation to service providers, or technical testing. The time required is primarily determined by your company’s processes.
- Participating in an online training session or watching the recorded version, as well as achieving initial work results with the new software, takes approximately 2 hours per person.
Step 3:
- Measuring software usage requires no effort on your part, as telemetry data is collected and analyzed by us.
- Planning additional training sessions takes about 1 hour, while each training session itself lasts approximately 30 minutes.
Your IT department is responsible for deploying the software on users' PCs, providing first-level support, and handling software updates as needed (the latter only applies if your company opts out of automatic updates).
We offer 3–4 software updates per calendar year, though customers typically implement 1–2 updates annually.
The total IT and support effort amounts to approximately 0.25 FTE per year.
 About us
Your benefits with empower
High-performance charting made easy.
Access all standard and advanced chart types—including waterfall, Mekko, and Gantt—with complete control over every detail, from axes and breaks to arrows and number formats. With empower®, you can create agency-quality Gantt charts with ease.
Automated reporting
with built-in control
Link Excel data to all chart types, including Gantt, as well as to text and tables, for fully automated report generation. The Link Manager keeps everything organized and lets you easily adjust data sources.
Powerful features
at a fair price
Create professional, high-quality charts with robust functionality - at a price that’s built to compete.
Questions
We've created this overview to provide you with all the information you need about empower® without having to contact our sales team.
- (Grouped) column and bar charts
- (Multi-level) waterfall charts
- Gantt charts
- Line, area, circle, ring and point charts
- Column-Mekko and Marimekko charts
- Network diagrams
- In addition, the combined display of columns and lines within a chart is possible
Good news - it is short, with only a few hours of productive work (i.e. producing results at the same time), for two reasons: on the one hand, people who create charts on an ongoing or frequent basis are usually experienced in this activity. They are not doing it for the first time. On the other hand, the empower software has been developed in such a way that it integrates seamlessly into the PowerPoint visuals and is intuitive to use thanks to its friendly GUI - especially for people who already have some experience in creating charts. We support you during the introduction with training, accompanying materials and numerous short videos that explain the software in the best possible way so that the introduction is a success.
During the introductory phase and afterwards, we measure the use of the software functions (event-based and anonymous). The data is collected on the empower telemetry server and provides an accurate picture of the frequency of use and the individual functions used. Together, we identify peaks and troughs in usage and use training to effectively adjust those functions where greater usage would be desirable.
empower is Microsoft-certified and a compatibility partner, i.e. all updates released by Microsoft for M365 are always compatible with empower®.
Changes to diagrams without the appropriate software are neither possible nor useful. Why? On the one hand, without the software, users do not have access to all the functions they would need to create or customize professional charts. These include special chart types such as Gantt charts or multi-level waterfall charts, arrows, breaks, special axis settings and individual data labels. On the other hand, changes to charts without the original software lead to technical changes to the charts. This in turn means that the charts can often no longer be read in (correctly) by the software, which means that further editing of such diagrams with the software no longer works. Users who use the software would have to create them again - an unnecessary duplication of work. Our solution is to offer the software at a moderate price so that small and medium-sized companies can make it available to all users. For larger license volumes, we also offer attractively priced corporate licenses. This effectively prevents anyone from having to edit charts created with the software without it.
Yes, such Excel links are possible and are used by many customers.
Yes, the “Use relative path” option can be activated when creating Excel links. This means that the Excel link remains in place even if the pair of linked Excel and PowerPoint files (sent and then moved by the recipient) is moved to a different location.
If by "compatible" you mean the ability to run both add-ins in PowerPoint without issues—yes, that is possible. However, there is one situation where it’s advisable to disable other charting software. This involves converting charts into empower® format. This feature helps users transition to empower® without needing to recreate existing charts from scratch.
empower is ISO27001-certified and develops its software to the highest security standards. You can find out more about security at empower here.


