A presentation not only contributes to a company's visual identity, it’s also the key to effective communication. PowerPoint presentations are still one of the most important tools for conveying information, explaining concepts, and persuading audiences.
But while content is undoubtedly king, design is often neglected - which is where PowerPoint templates come in. Using PowerPoint templates is about more than just “looking pretty”. It's about creating a consistent visual experience that grabs attention, reinforces the message, and facilitates the transfer of information. All in the most effective way.
- Why do templates matter?
- Types of templates
- How to create the perfect template
- Tips for creating the perfect template
- Template trends 2024
Why do templates matter?
PowerPoint templates offer many advantages:
- Adherence to corporate design: Templates provide a consistent look and feel to presentations. When templates reflect a company's corporate design, they contribute to a professional appearance. Templates help ensure that brand guidelines are followed and that the company is represented in a consistent manner.
- Save time and money: You can use and customize existing designs instead of starting from scratch. This saves time and money, especially if you create presentations on a regular basis.
- Increased flexibility: Templates provide a basic framework but are still customizable. Colors, fonts, images, and layouts can be changed to meet the specific needs of a presentation.
- Prevent errors: Predefined designs reduce the risk of formatting errors or inconsistencies.
- Increase efficiency: When multiple people are working on a presentation, templates make it easier to collaborate because all team members can use the same design guidelines.
Types of templates
There are PowerPoint templates for a wide variety of situations. Templates can be assigned to different categories. Categorization helps with organizing storage and provides an overview and orientation.
Map templates
Map templates are used to display geographic information, locations, or data on a map. These templates can include different types of maps, such as world maps, country maps, regional maps, or thematic maps that visualize specific data (such as population density).
Chart templates
Chart templates are predefined designs or layouts specifically for visualizing data in the form of charts. These templates provide a structure and design for presenting information in a clear and attractive manner.
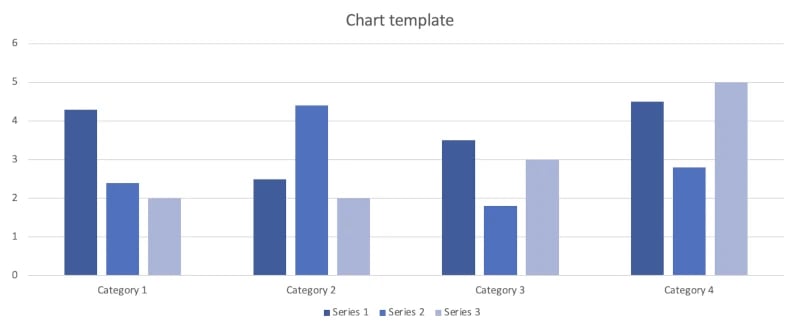
The most common types of charts in PowerPoint are Gantt charts, bar charts, pie charts, line charts, area charts, waterfall charts, and Mekko charts.
This includes timeline and cycle templates that visually represent process flows, time sequences, or recurring cycles.
Especially when it comes to charts, the corporate design of the company is often disregarded. This mistake cannot happen with chart templates.
Structuring templates
These are special layouts or designs used to help organize and structure a presentation. These templates provide slide layouts to help you present your content in a logical and clear manner. They include title slides, overview slides, text slides, picture slides, subheading, and section slides, and closing slides.
Structuring templates in particular help keep your presentation consistent and cohesive.
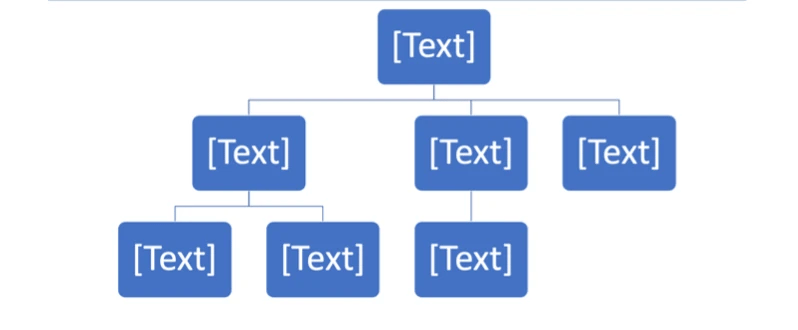
Organization chart templates
These templates offer a variety of charts and layouts that show an organization’s structure, hierarchy, teams, departments, and their relationships. Organization charts are usually the most time-consuming to create, so templates can be very helpful. Formatting work can be reduced this way.
Argumentation templates
These templates present arguments, beliefs, or points of view in a clear and compelling manner. They can leave plenty of room for statistics, graphics, or quotes. They can also include lists of pros and cons, argumentation diagrams, or cause-and-effect visualizations.
Infographic templates
Infographics are growing in popularity. Especially in the context of visual storytelling, infographics captivate audiences. The problem is that creating infographics can be time consuming. If you can shorten this step by creating a template that allows employees to create and customize infographics much faster, you will have a big advantage.
You can create them using shapes and icons, for example.
Storyboarding, the supreme discipline of creating templates
Storyboards are graphical representations or sequences of images used to sketch out the visual flow of a story, movie, presentation, or project. They also play a special role in visual storytelling.
A storyboard can be displayed on a single slide (as shown in the image below) or spread across multiple slides.
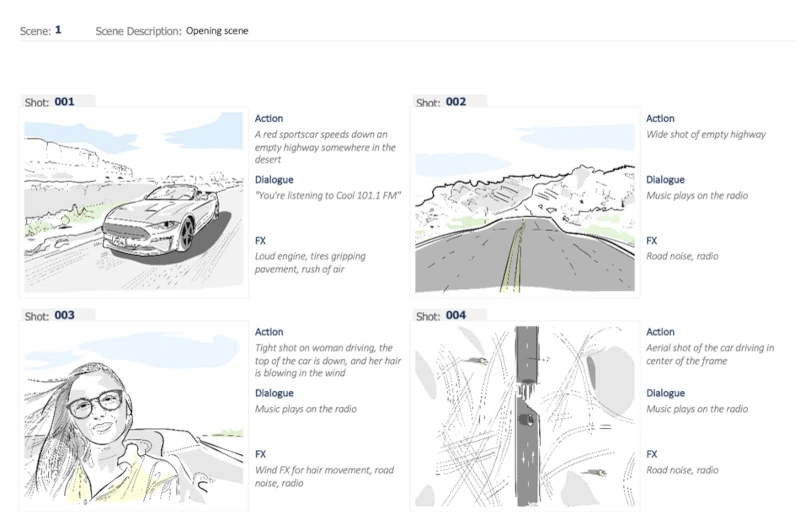
In marketing, for example, storyboards help plan and outline the flow of a presentation, advertising campaign, or project.
How to create the perfect template
Before you start creating, you should think about what kind of template you want to create, what elements it should contain, and what it should look like.
The creation is done from the slide master. Select this via View > Master > Slide Master. Now you can create your template. Use Insert to select images, icons, shapes or SmartArt. You can also use a template suggested by PowerPoint or search for a template when you open PowerPoint and then customize it in the Slide Master.
When you are satisfied with the result, save your template. Important: When saving, select the .potx format - this is the only way to save your master slide as a template.
Did you know that you can create templates in Word as well as PowerPoint?
Tips for creating the perfect template
- Follow your company's brand guidelines by using the right colors, fonts, and logos. The color scheme, in particular, should be adjusted before the template is actually created.
- Keep the design consistent and professional.
- Add placeholders for text, images, or charts to your slides. This gives others a clear idea of where to insert content. But be careful: Ideally, do not use more than 3 merge fields. In some cases, merge fields can cause uncontrolled and unwanted format changes. The fewer merge fields you use, the lower the risk.
- Make the template flexible enough to accommodate different types of content without compromising the design.
- Avoid excessive animations, too many effects, or overloaded slides.
- Place important information or key elements in strategic locations on the slides to improve readability and comprehension.
- Consider "reading direction" and place relevant content from left to right and top to bottom according to typical reading habits.
- For chart templates: first, create your chart outside the master slide. Save it and then insert it into the template.
- If you want to create several templates at once, always start with the master slide and then use the layout slides (indented pages). Changes you make to the master slide, such as the footer, are automatically applied to the other layout slides.
- Display guides indicate the placement of content and to achieve a consistent layout.
- Select the proper page format: 16:9 or 16:10?
- Select the right language. Just because the company speaks English doesn’t mean that most presentations will be in English.
Note: templates can only be created in the desktop versions, not on the web.
Template trends 2024
This year's general PowerPoint trends will also affect the way we create templates. Let’s take a closer look at the current trends.
1. Minimalism
Less is more - minimalist presentations focus on the content of the presentation rather than the design. This means that layouts are kept simple. They tend to be clean and intuitive. The use of white space enhances this effect. All slide elements have a reason to exist and aren’t just superfluous “slide fillers”.
The typography also matches the minimalist design. It not only conveys the text, but also forms a unity with the design to convey a harmonious narrative.
Use natural colors if the corporate design allows. Colors in presentations should relate to the themes of nature and sustainability in 2024.
2. Visual storytelling
Visual storytelling combines visual elements with a narrative structure to effectively present information and engage audiences. This type of presentation is especially useful for data visualization. It includes dynamic charts, infographics, interactive elements, and more.

3. Multimedia integration
The days of static templates are long gone, and dynamic templates are the order of the day. Integrating multimedia into presentations leads to greater audience attention, emotional connection, and improved retention.
Some of the multimedia elements that you can include in your presentations are videos, Ted Talks, animated GIFs, sound effects, or QR codes. Photos also belong in this section. Stock photography is less of a trend because it’s usually recognizable as such. Have you ever tried AI-based image generation? With the right prompt input, it can produce unique results.
With empower® template management for Microsoft 365, all templates are at your fingertips. All you have to do is choose the one that suits your presentation. Everyone has the latest design assets and templates at their fingertips. The result is professional, brand-compliant documents and presentations in no time.
Access them directly from Microsoft 365 applications. Templates are made available company-wide via the central empower® slide library. This makes life much easier, especially for the IT department. IT no longer has to worry about distributing templates; departments can do it themselves.
Still have questions? Please do not hesitate to contact us.


Create Word templates: Step-by-step guide

Dynamic templates: benefits, uses, and tips