Data visualization is an area of business intelligence that translates complex or extensive data into a visual representation. For example, diagrams, graphics, or maps all visualize data in PowerPoint. However, especially with large amounts of data processed by different people, the process of data visualization often results in chaos.
Many companies have found a remedy for this problem with data visualization software or data visualization tools. Product comparison platforms can help discover which software is most suitable for the individual needs of the company. But before you start searching for a suitable tool, you should first internalize what challenges you face in data visualization and how the software can support you.
- Data visualization in the company
- Benefits of data visualization
- Challenges of data visualization
- What can data visualization do for you?
- Types of data visualization software
- Data visualization with empower® Chart Creation
Data visualization in the company
Data visualization can affect any department. Managers often deal with large volumes of data. They need to prepare this data clearly and present it visually in a way that’s appropriate for the target group, so that colleagues or external parties can also understand it. Think of the finance or sales departments. They regularly compile sales and cost developments and explain them in comprehensive presentations.

People spend many valuable hours getting to grips with all the available data and then visualizing it “on paper”. Data visualization is often done in Office applications such as PowerPoint.
What are the benefits of data visualization?
Data visualization offers so many benefits that there’s really no reason why you shouldn’t use it:
- Data visualization provides important insights at a glance, which you'd otherwise have to search for individually.
- Decision-making processes at every level are accelerated because decision-makers can concentrate on essentials thanks to a concise presentation.
- Data visualization contributes to the success of your company because correlations and trends can be recognized more easily.
- You save a lot of time because many manual formatting tasks are no longer necessary.

Challenges of data visualization
The big challenge of data visualization is the amount of time and effort that goes into translating data points to a simplified visual presentation. First, you need to get an overview of the data yourself, understand it across the board and contextualize it. This takes a lot of time! Then you pick a form of representation that best explains the data: the challenge is to avoid possible misinterpretation of the data. And beware! Transcription and clerical errors arise faster than you might think when manually converting the data to the visualization.

Another problem often is that not only are you responsible for evaluating and visualizing a data set, but your colleagues also have to deal with this same data set. This can cause two types of problems:
1. Several employees, one data visualization
Often several people deal with the same data. Theoretically, each person can examine the data themselves. That’s an absolute time killer through redundant work! Instead, the data should be visualized. Who is responsible? Should the work be divided? Each person could do a bit of visualization. But that opens a lot of potential for conflict and chaos and probably leads to the transmission and clerical errors mentioned above. Or does the most technically gifted person get to do the visualization? In the long run, that person can hardly do other things.

2. One employee, several data visualizations
You or your colleagues are regularly confronted with complex or massive data. You’re constantly busy visualizing it. You lose many valuable hours every week that could be used for more important things. The result: overtime, incomplete or incorrect data visualizations, frustration.
What can data visualization do for you?
Data visualization software or data visualization tools will save you a lot of work and trouble. They can even employ algorithms that automatically pick out the best visualization form for you. The big advantage: you can still create your own graphics if you want to. All you need to do is select data visualization software that meets your needs.
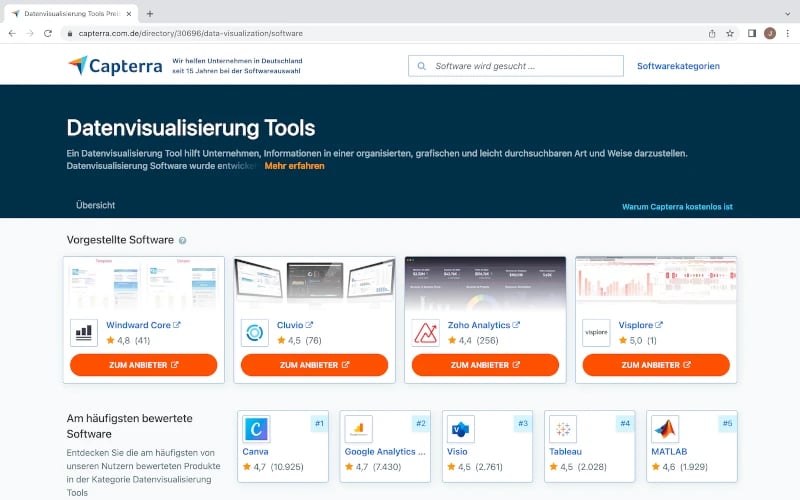
Comparison portals such as Capterra will help. You enter the phrase “data visualization tools” in the search bar and get several hundred results, which you can filter according to your wishes.
The decisive factor in the choice of software is user-friendliness. The software should be clearly structured and easy to use. And you should also be able to use the data visualization software on the move - a great advantage if you or your colleagues work a lot on the road.
What types of data visualization software are on the market?
The number of data visualization software solutions is huge. They can differ, for example, according to the following criteria:
- Customizable vs. non-customizable Dashboard.
- Cloud-based vs. non-cloud based.
- Third-party integration vs. no third-party integration.
- Automated vs. non-automated reporting.
- Deployment to Windows and/or Mac.
One thing is certain: data visualization software is indispensable for improving business success and accelerating decision-making processes. To find the optimal data visualization tool or software for your use cases, it’s best to think about what benefits you want from the software. Based on those insights, you’ll find the best solution.
To help you find the best data visualization tool, we’ve compiled three popular tools below:
1. Canva
Canva is a graphic design tool that lets you create professional layouts for presentations and social media graphics using drag-and-drop . The tool is easy to use and offers a large selection of design templates. In addition, it’s free of charge. Canva is a good choice to get a taste of the world of data visualization tools.
2. Better reports
Better Reports is an online SaaS (software as a service) tool. Here too, you can create custom tables and charts using drag-and-drop. A free trial version also gives you the opportunity to test the tool without any obligation.

3. Piktochart
With Piktochart’s charts and maps, you can quickly visualize data. You simply link an Excel file with the tool. A practical benefit: the charts update automatically when your spreadsheets change. A free trial version is available.
Data visualization with empower® Chart Creation
Another Office-oriented data visualization tool that you can also find at Capterra is empower® for charts in PowerPoint. This PowerPoint add-in for Microsoft Office allows you to visualize data quickly and seamlessly in line with your corporate branding. You can easily design complex charts intuitively and link them to Excel files - empower® does most of the work for you. Choose not only between bar and line charts, but also between stylish Gantt charts or easy to understand waterfall charts. The empower® PowerPoint add-in facilitates chart creation far beyond standard PowerPoint functions. It makes data visualization simple, consistent, and efficient – directly within MS Office where most people spend their days. And it works both online and on the go, with always up-to-date centrally managed corporate design compliance.

If you have further questions about empower® Chart Creation or would like to try our PowerPoint add-in, please contact us!

10 free stock photo sources for PowerPoint presentations

Create a Gantt chart in Excel in 8 steps