Creating a meaningful chart in PowerPoint can sometimes be challenging. A common problem with PowerPoint charts is the display of high absolute differences in bar charts. A column with a high value stands next to a column with a low value, making individual values difficult to read. We explain in 4 simple steps how to use breaks in empower® Chart Creation to create an easy to read chart.
What are breaks in PowerPoint charts?
Breaks in PowerPoint charts (often utilized via charting add-ins) are visual interruptions on the axis or data series that break the continuity of values. They are used to shorten disproportionately large bars or jump over gaps in data (e.g., years 2010 to 2019), allowing smaller, critical data points to remain visible and readable.
How do you insert breaks into PowerPoint charts?
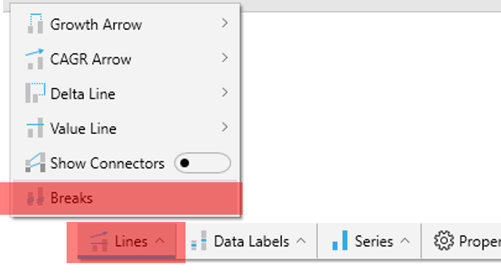
- To be able to set breaks, click on "lines" in the action bar above the chart and select "breaks".
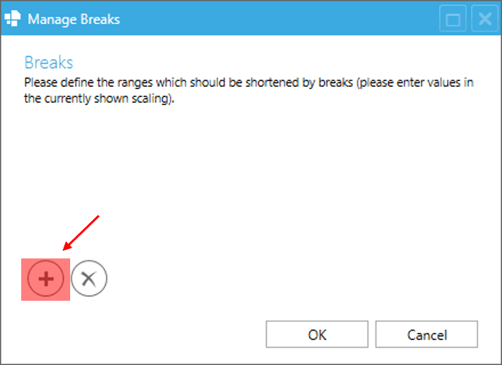
- Now click on "+" to add a break.
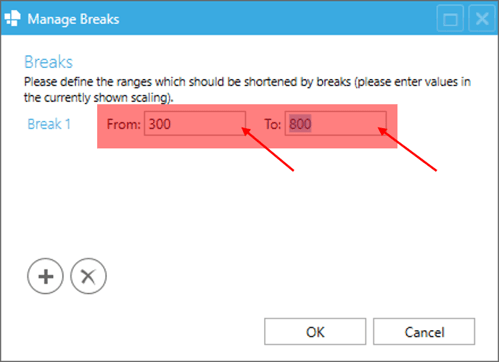
- To set a break, you must define an area that is shortened by the break. However, this range must be within the values of the highest column.
- Confirm the entry with "Ok". Then the chart is adjusted.
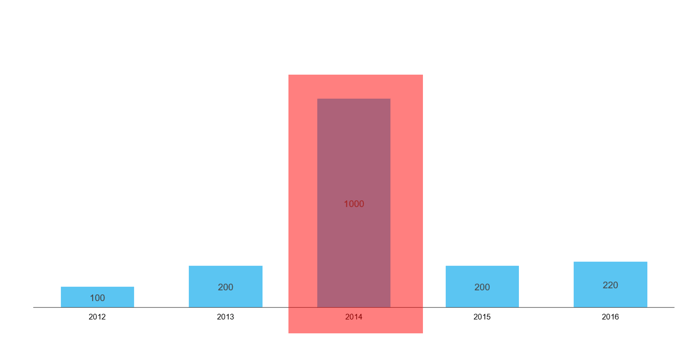
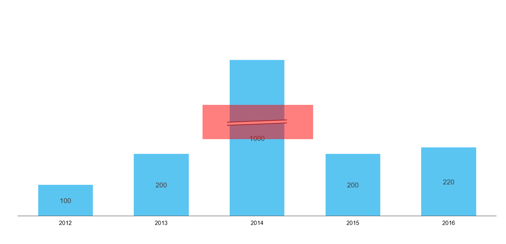
In our example, we have created a bar chart. The value from 2016 is comparatively much higher than the other values. Breaks can be set to make the difference between the other years clearer.
Step 1: Open the action bar
To be able to set breaks, click on "Lines" in the action bar above the chart and select "Breaks".
Step 2: Add Break
Now click on "+" to add a break.
Step 3: Define an area
To set a break, you must define an area that will be shortened. However, this range must be within the values of the highest column. In our case, a range between 300 and 800 makes sense. This area is then "cut out" so that the column is shortened.
Step 4: Confirm input
Confirm the entry with "OK". Then the chart is adjusted.
The break makes the middle column look as simple as if you had cut out a part with scissors. Now the different years can be easily distinguished again. The break is marked by two lines in the middle of the column.
What is empower® Chart Creation for PowerPoint charts?
empower® Chart Creation is a powerful PowerPoint add-in that enables fast creation of complex charts and reports. Compared to using standard PowerPoint tools, empower® Chart Creation regularly saves users up to 50% of their time.
The solution includes key business chart types – from waterfall and Gantt to Mekko and combination charts. Thanks to smart Excel integration and automatic updates, linked charts, text, and shapes always remain current. Charts placed in placeholders are automatically formatted, with elements like arrows and lines arranged consistently. Charts from third-party tools can be converted with a single click – and are immediately ready for further editing.
The result is professional charts and reports that impress with clarity and consistency – empowering faster, more informed decision-making.
Do you want to go one step further and make sure that all Office documents in your company comply with the corporate design? Then we have the perfect approach for you with our Template Management solution!
Contact us! Our experts are looking forward to hearing from you


Modern PowerPoint charting – Why businesses choose empower® Chart Creation

Creating Gantt Charts in PowerPoint for clear and professional project planning